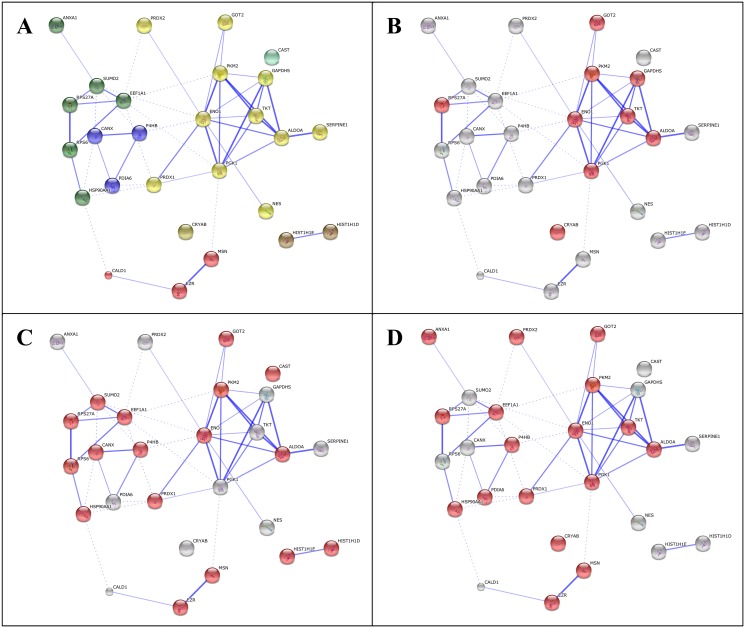
Fig 5. The 27 proteins which were significantly deregulated in glia treated with AD plasma, but not deregulated in either control or MCI plasma treated glia (shown in Table 4) were analysed in STRING v9.1.
MCL clustering was used with the 2 clusters option picked and with the confidence view selected to display the strength of evidence for protein associations (panel A). Analysis of enrichment was also performed and the most significantly enriched biological process was glucose metabolic process (FDR p-value = 1.759x10E-8, with the 9 proteins involved in this process shown in panel B). Other distinct biological processes which were also significantly enriched included response to hydrogen peroxide (FDR p-value = 3.559x10E-2 with 4 proteins involved; ANXA1, PRDX1, PRDX2, CRYAB) and membrane to membrane docking (FDR p-value = 4.299x10E-2 with 2 proteins involved; MSN, EZR). Several molecular functions were also enriched, the most significant being RNA binding (FDR p-value = 5.340x10E-9 with 17 proteins involved shown in panel C). Another distinct and significantly enriched molecular function is thioredoxin peroxidase activity (FDR p-value = 9.220x10E-3 with 4 proteins involved; PRDX1, PRDX2). Several cellular components were also enriched, the most significant of these being extracellular vesicle exosome (FDR p-value = 5.019x10E-9 with 17 proteins involved as shown in panel D). Multiple other significantly enriched cellular components were also observed, and all enriched protein groups are shown in Table 5.

