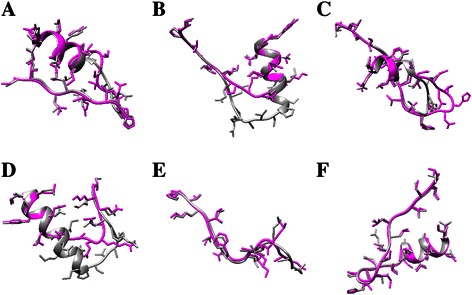
Figure 2.

Comparison between local changes of the predicted structures and WT EGFR. (A -F) display an example of insertion, deletion, duplication, modification and substitution (single-point and double-point), corresponding to V769_CV_D770, delE746_S752, dulN771_H773, delT751_I759insN, L165Q and S72IV78M, respectively. The dark gray chains represent the WT structures while the magenta chains stand for the predicted ones with Rosetta.
