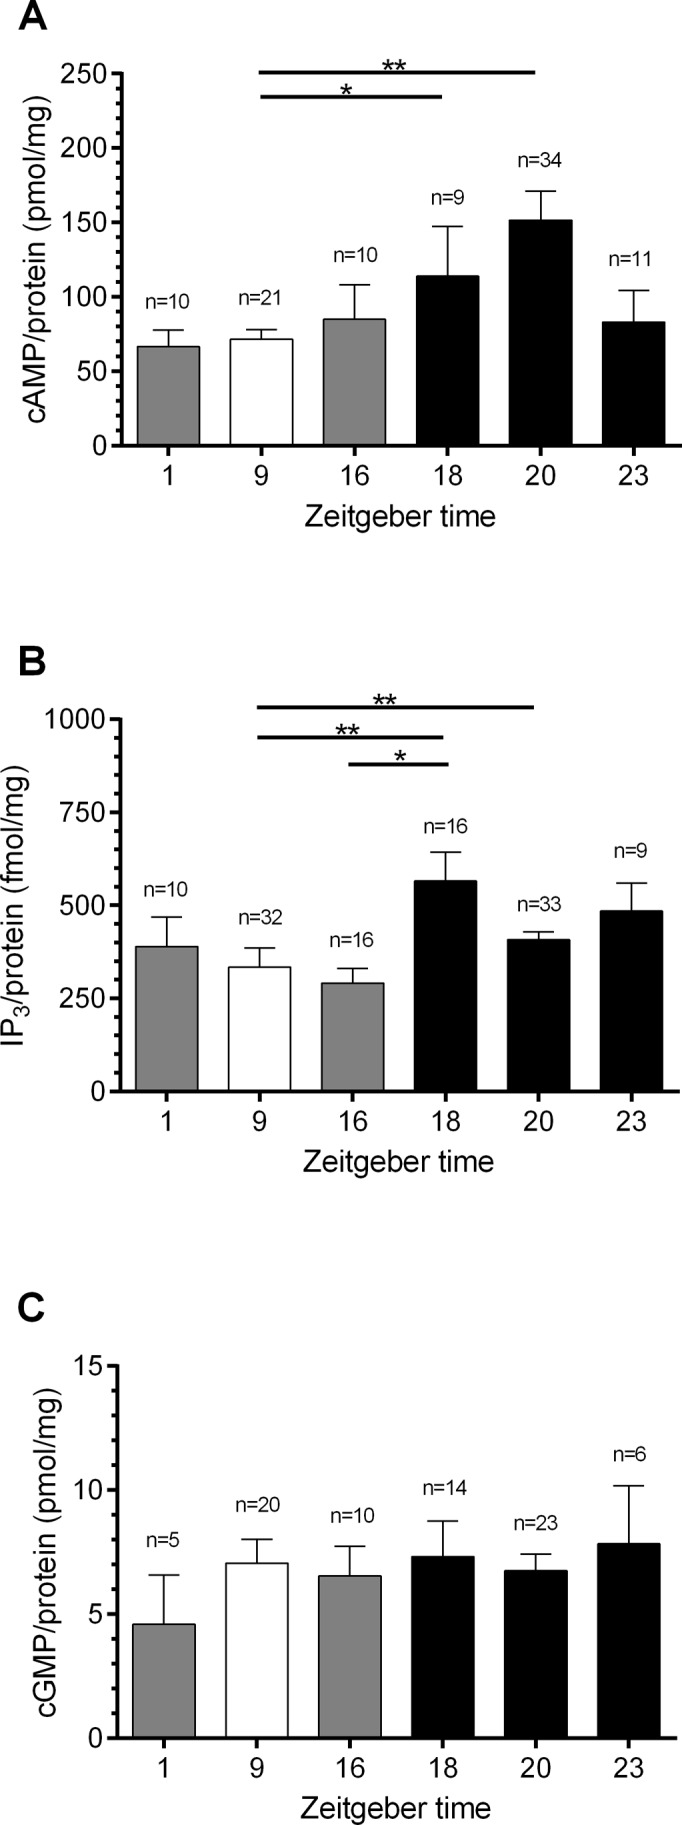
Fig 3. Hawkmoth antennae show Zeitgebertime (ZT)-dependent changes in cAMP- (A) and IP3- (C), but not in cGMP (B) baseline levels (n = 1 contains 6 antennae).

A: The maximum in cAMP concentration measured with ELISAs at ZT 20 (151.5 pmol/mg, n = 34) and the minimum at ZT 9 (71.5 pmol/mg, n = 21) differ highly significant from each other (Dunn’s post hoc test, ** p < 0.01). B: The IP3 level peaked at ZT 18 (565.2 fmol/mg, n = 16) and was minimal at ZT 16 (291.5 fmol/mg, n = 16, Dunn’s post hoc test, * p < 0.05). C: cGMP levels remained constant during the day. Open columns = light phase; grey columns = dusk and dawn; closed columns = dark phase.
