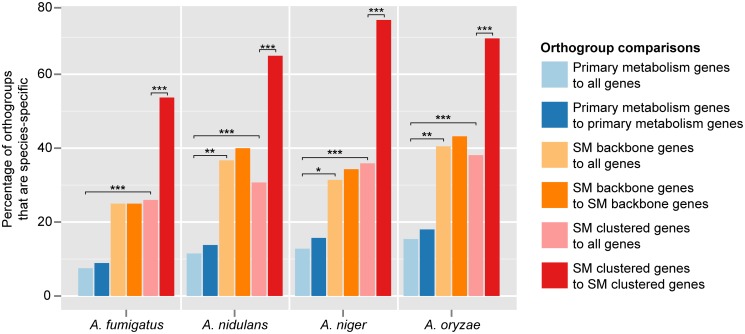
Fig 2. Many more Aspergillus SM genes are species-specific than primary metabolic genes.
For each species, dark blue bars indicate the percentage of primary metabolism orthogroups that is species-specific when compared to all genes annotated as participating in primary metabolism in the other three species; light blue bars indicate the percentage of each species’ primary metabolism orthogroups that is species-specific compared to all genes, irrespective of their annotation, in the other three species. Similarly, light orange bars indicate the percentage of each species’ SM backbone synthesis orthogroups that is species-specific when compared to all genes annotated as SM backbone synthesis genes in the other three species; dark orange bars indicate the percentage of each species’ SM backbone synthesis orthogroups that is species-specific compared to all other genes. Light red bars indicate the percentage of each species’ clustered SM orthogroups that is species-specific when compared to all genes annotated as clustered SM genes in the other three species; dark red bars indicate the percentage of each species’ clustered SM orthogroups that is species-specific compared to all other genes. Asterisks indicate statistically significant differences based on a P-value ≤ 0.01 (*), ≤ 0.001 (**), or ≤ 0.0001 (***) in a two-tailed Fisher’s exact test (S4 Table).

