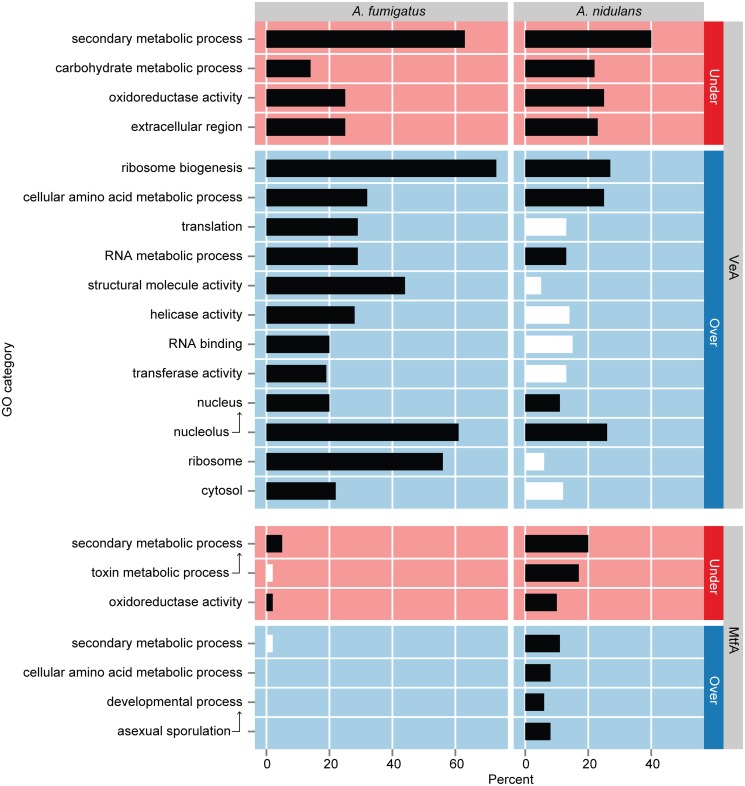
Fig 3. GO term enrichment analysis of genes differentially expressed in ΔveA and ΔmtfA relative to wild type in A. fumigatus and A. nidulans.
Statistically overrepresented gene ontology (GO) categories in under-expressed (red) and over-expressed (blue) gene sets in ΔveA and ΔmtfA relative to wild type. Arrows point to GO term ancestors. Horizontal bars show the percentage of each gene set assigned to a particular GO term with black bars indicating significant enrichment (Benjamini & Hochberg adjusted P-value ≤ 0.05 in a hypergeometric test; S6 Table); white bars indicate no significant enrichment.

