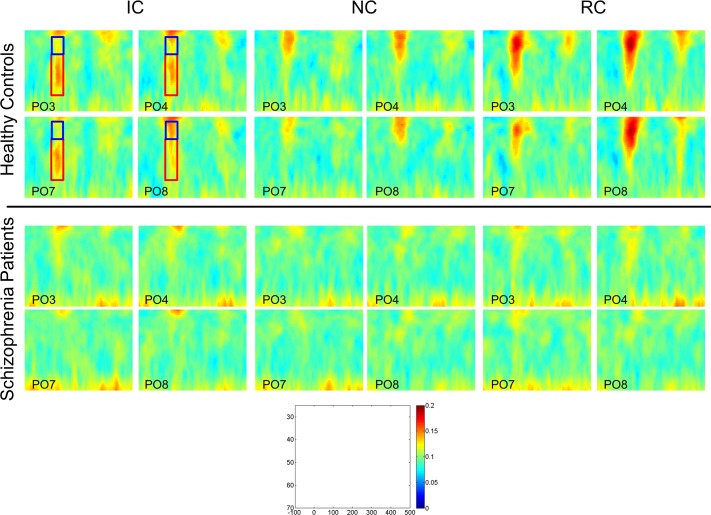
Fig 4. Time-frequency plots of phase locking factor for controls (top) and patients (bottom) for all three figure types.
Plots from four representative electrodes (PO3, PO4, PO7, PO8) are shown. The scale for each plot is included. Frequency is plotted on the y-axis and ranges from 25–70 Hz (from top to bottom); time from onset of the stimulus is plotted on the x-axis and ranges from-100 to 500 ms. The blue box highlights the 30–40 Hz band and the red box the 40–60 Hz band that were analyzed.

