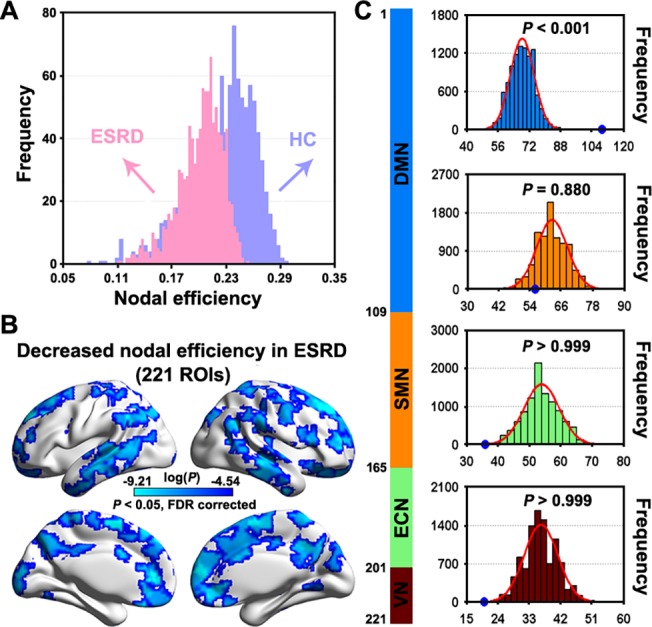
Fig 4. Between-group differences in regional nodal efficiency.

A, histogram of mean nodal efficiency showed an evident shift towards overall decrease in patients with ESRD compared to HCs. B, statistical analysis revealed that the global decrease was driven by numerous regions that predominantly located in lateral and medial prefrontal cortex, motor cortex, posterior parietal cortex, lateral temporal lobe and occipital regions. C, empirical frequency distributions of 221 randomly selected ROIs (10,000 times) in each of the four modules in Fig. 2A. ESRD, end-stage renal disease; HC, healthy control; ROIs, regions of interest; DMN, default mode network; ECN, executive control network; SMN, sensorimotor network; VN, visual network.
