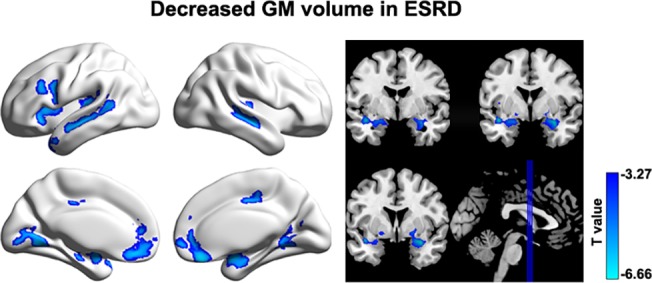
Fig 7. Between-group differences in gray matter volume.

Multiple cortical and subcortical regions were identified to show gray matter atrophy in ESRD patients compared to HCs. Of note, no significant correlations were observed between nodal efficiency decreases and GM gray matter atrophy in the patients (P > 0.05, False Discovery Rate corrected). GM, gray matter; ESRD, end-stage renal disease.
