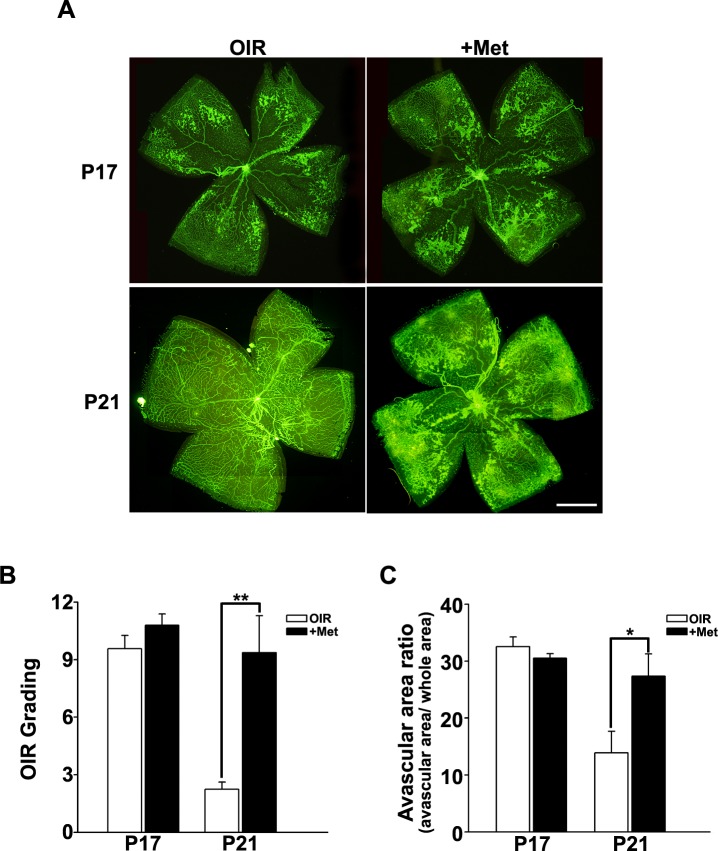
Fig 2. OIR scores and quantification of avascular areas.
(A) Flat-mount images showed the same features as were observed in fundus and fluorescein angiographic images (Fig. 1). Both saline-treated OIR (OIR) and metformin-treated OIR (+Met) mice showed central avascular areas, tortuous vessels, and vessel tufts. At P17, retinopathy features were similar between the two OIR groups, but at P21, metformin-treated OIR mice showed poorer vessel growth and diminished retinopathy regression. (B) Retinopathy scores were similar at P17, but metformin-treated OIR mice showed higher scores than OIR mice at P21. (C) Evaluations of avascular areas in the retina revealed no differences between the two OIR groups at P17, but metformin-treated OIR mice exhibited wider avascular areas than saline-treated OIR mice. Original magnification, ×40; scale bar, 100 μm. *P < 0.05, **P < 0.01 (Mann-Whitney U test); P17: n = 7/group, P21: n = 8/group.

