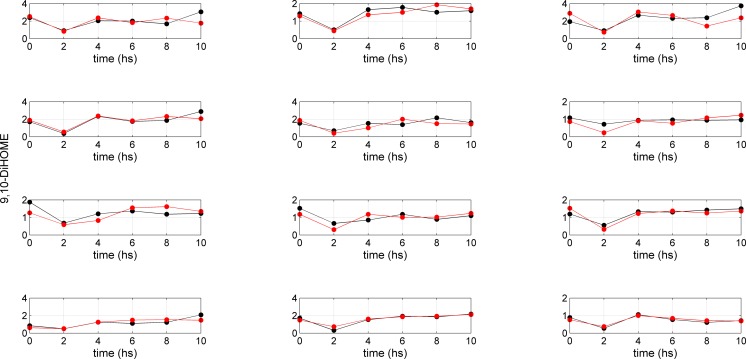
Fig 3. Concentration time profiles for 9,10-DiHOME.
Measured (black dots) and fitted (red dots) time concentration profiles for 9,10-DiHOME (AA metabolism) for 12 subjects. The regression parameter A, lumping the coefficients P and D (dimension t-1) describing the production rate and the degradation rate for 9,10-DiHOME (see Equation (3)) is obtained under a pseudo-steady-state approximation (Equation (4)) and obtained via Equation (7).

