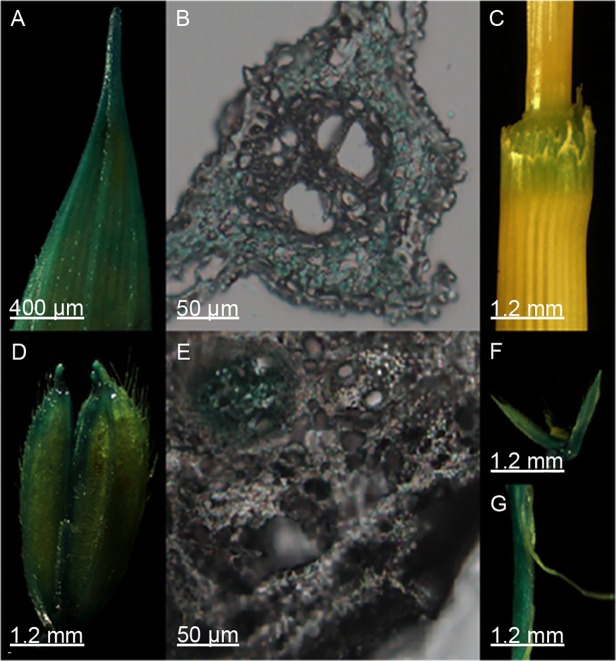
Fig 2. Expression patterns of GUS driven by the CYP71Z2 promoter in various organs and tissues of transgenic rice plant.
Shown are leaf (A), node (C), lemma and palea (D, F), primary root (G) and transverse section of a leaf (B) and node (E). Scale bars are 400 μm (A), 50 μm (B, E) and 1.2 mm (C, D, F and G).

