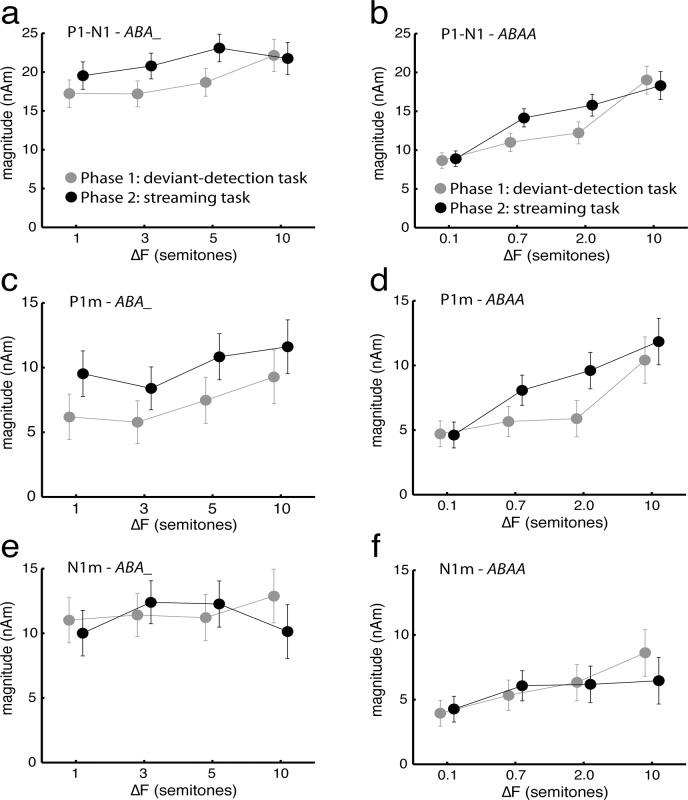
Fig 3. Amplitudes of the P1m and N1m evoked by the streaming stimuli.
(a, b) P1m-N1m Peak-to-peak magnitude, (c, d) P1m peak magnitude, and (e, f) N1m peak magnitude. The responses were measured for the B tones of the ABA_ (a, c, e) and ABAA (b, d, f) patterns, the frequency of which was always 1000 Hz. All values are mean source magnitudes across subjects (N = 19); error bars indicate standard errors of the mean.

