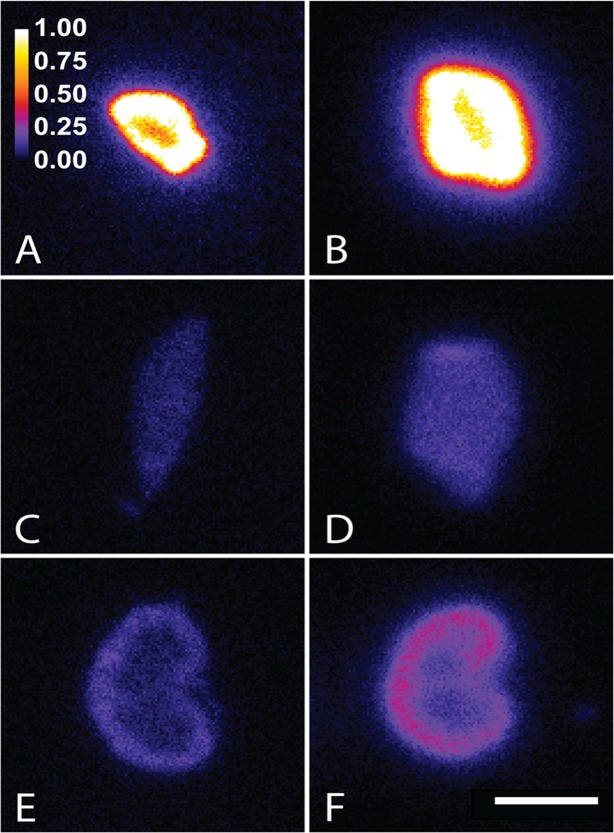
Fig 2. Autoradiographs acquired using the novel iQID camera.
Panels show the distribution of 177Lu (A, C, and E) and 90Y (B, D, and F) 24 hours after injection of labeled DOTA-biotin in 1F5-SA-pretargeted tumor (A and B), liver (C and D), and kidney (E and F) cryosections. The scales apply to all panels; the color bar represents relative pixel intensity normalized to the mean for the tumor sections and the white scale bar indicates 5 mm.

