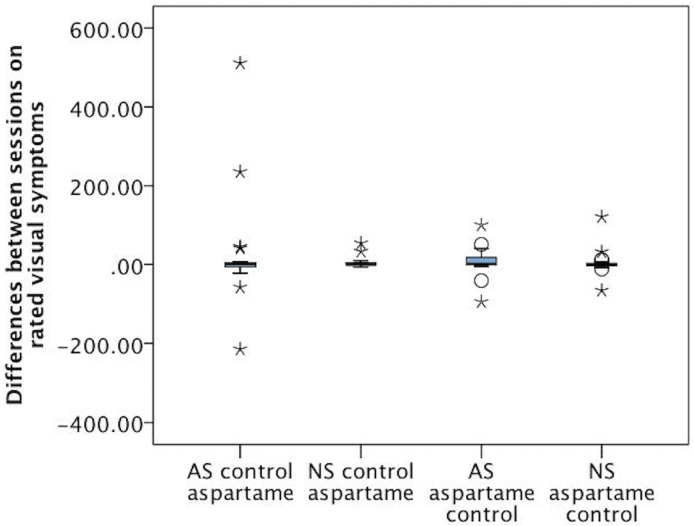
Fig 2. Differences between ratings of visual symptoms across session one and session two.
Positive differences indicate that aspartame was rated higher than control. AS = Aspartame sensitive, NS = Non sensitive. It can be seen that there were no differences between groups on ratings, but the aspartame sensitive participants who rated control bars first included three outlier participants more extreme than any in the other groups.

