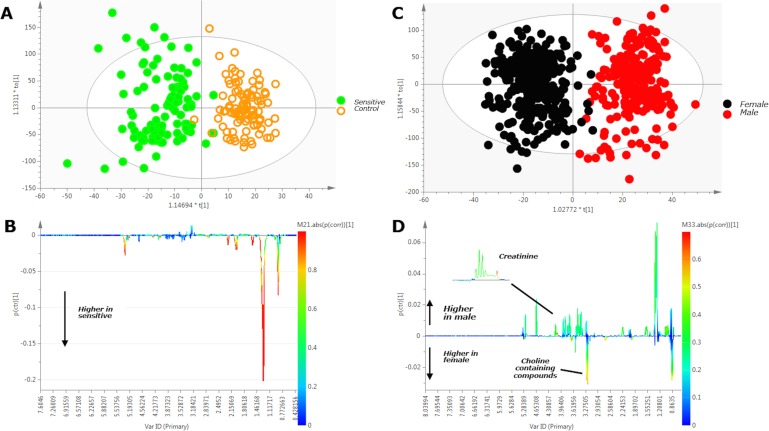
Fig 3. Analysis of 600 MHz 1H NMR human serum baseline (pre-bar consumption) data from sensitive and control participants (A), and female and male participants (C).
3A. OPLS-DA scores plot demonstrating that metabolic variation is dominated by inter-group (sensitive versus control) variation; 3B. OPLS-DA regression coefficient loadings plot (in the form of pseudo-NMR spectrum) of sensitive vs. non-sensitive confirming discriminatory peaks of interest identified by analysis of the raw spectra as being strongly associated with lipids. The signal orientation indicates a higher concentration of characteristic lipid metabolites in the sensitive population; 3C. OPLS-DA scores plot demonstrating clear separation of male (red symbols) from female (black symbols) subjects; 3D. OPLS-DA regression coefficient loadings plot (in the form of pseudo-NMR spectrum) male vs female confirming discriminatory peaks of interest identified by analysis of the raw spectra. The signal orientation indicates increased creatinine in males and increased choline-containing metabolites in females. For the loadings plots in B and D, the color-coded scale reflects the significance of the correlation of each metabolite with the separation (red indicates highest significance and blue indicates no significance).

