Figure 2.

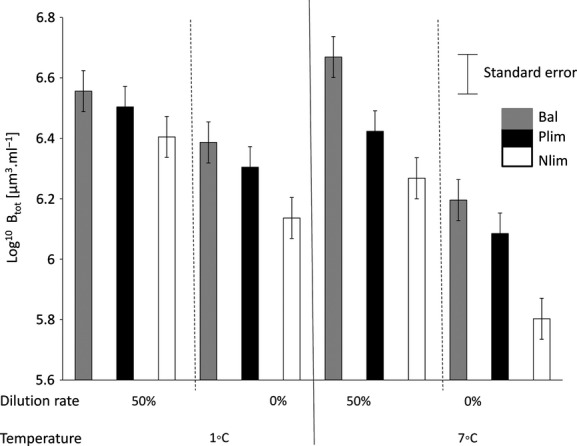
Variation of total biomass (Log10 Btot [μm3·mL−1]) with temperature (°C) and dilution rate and intensity of nutrient limitation (Bal, Balanced; Nlim, N limited and Plim, P limited).

Variation of total biomass (Log10 Btot [μm3·mL−1]) with temperature (°C) and dilution rate and intensity of nutrient limitation (Bal, Balanced; Nlim, N limited and Plim, P limited).