Figure 4.

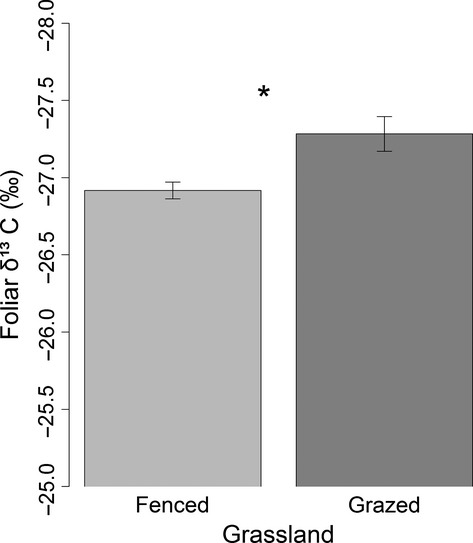
Difference in foliar δ13C under two different land-use types (fenced and grazing). Error bars represent standard errors of the means. Level of significance: “*”P < 0.05.

Difference in foliar δ13C under two different land-use types (fenced and grazing). Error bars represent standard errors of the means. Level of significance: “*”P < 0.05.