
Figure 2.
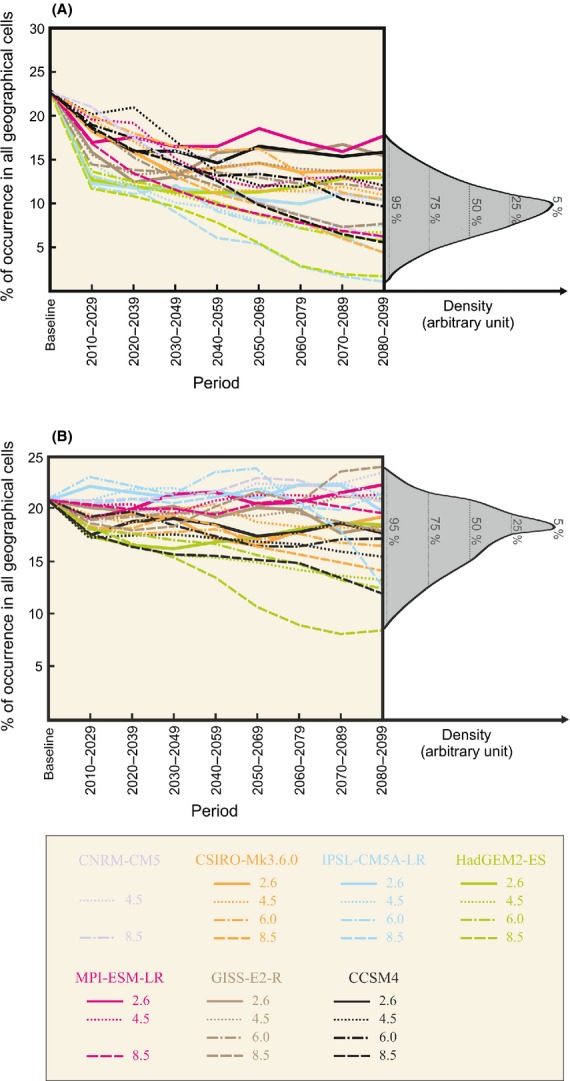
Long-term projected changes in the spatial extent (as percentage of occurrence) of (A) Betula nana and (B) Castanea sativa for each 20-year period of the 21st century, different intensities of warming and seven GCMs. Density diagrams (right) show the range of the percentages of occurrence for 2080–2099. Dotted vertical lines represent the percentiles 5%, 25%, 50%, 75%, and 95% of the distribution. The baseline period is 1950–2000. Percentages of occurrence were calculated for all climate scenarios (the low RCP2.6, the medium–low RCP4.5, the medium–high RCP6.0, and the high RCP8.5) and the seven GCMs: CNRM-CM5 (violet), CSIRO-Mk3.6.0 (orange), IPSL-CM5-LR (blue), HadGEM2-ES (green), MPI-ESM-LR (pink), GISS-ES-R (brown), and CCSM4 (black). The line-style denotes RCP climate scenarios. No simulations were available for the CNRM-CM5 with both RCP2.6 and RCP6.0 and for the MPI-ESM-LR with RCP6.0. See Table S4 for the meaning of GCMs.