
Figure 4.
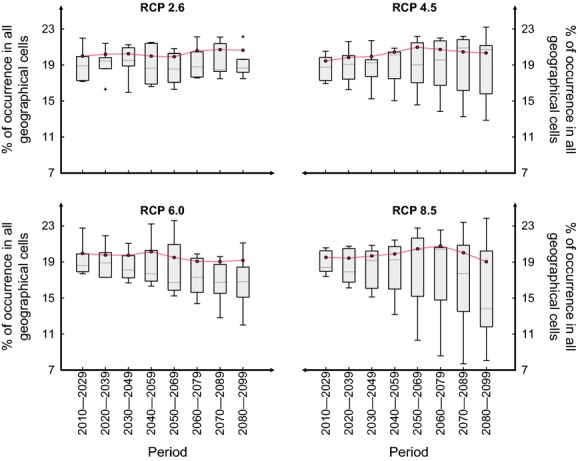
Comparison between changes in the spatial extent (as percentage of occurrence) of Castanea sativa calculated from the individual projections (boxplots in gray obtained from the different trajectories; Fig.2) and from averaging GCM outputs (red dotted-lines) for each 20-year period of the 21st century and each RCP scenario: the low RCP2.6, the medium–low RCP4.5, the medium–high RCP6.0, and the high RCP8.5.