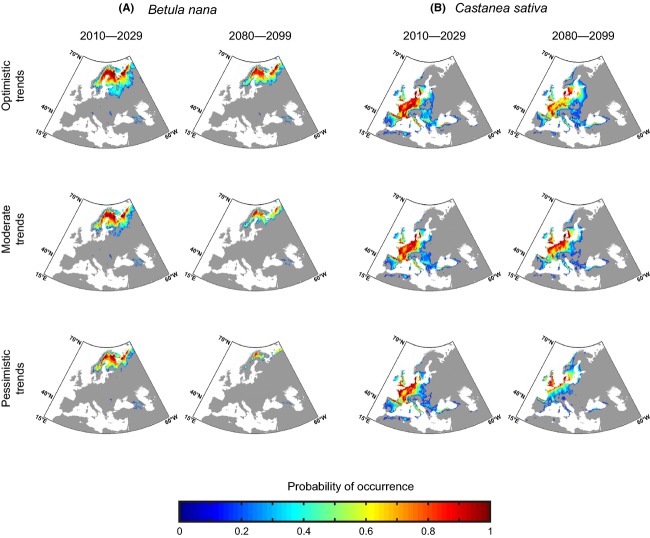
Figure 6.
Projections of short-term (2010–2029) and long-term (2080–2099) changes in the spatial distribution of the averaged probability of occurrence of (A) Betula nana and (B) Castanea sativa for three projected species trends: pessimistic, moderate, and optimistic. These categories of projections were based on 25 runs (see Fig.2). Gray geographical cells denote probabilities under the MDT criterion (see Materials and Methods).

