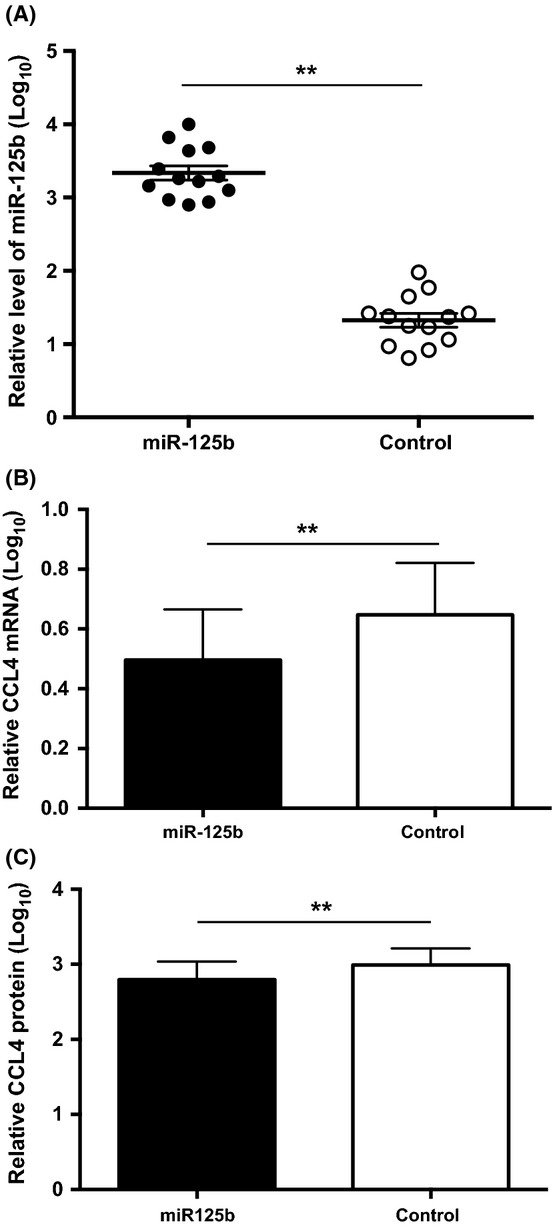
Figure 5.

Enhanced miR-125b expression and reduced CCL4 expression in naïve CD8 T cells. (A) Enhanced miR-125b level (∽78-fold) in naïve CD8 T cells transfected with GFP-tagged miR-125b expressing vector compared to naïve CD8 T cells transfected with GFP control vector. Twelve hours post-transfection, GFP-positive cells were isolated by cell sorting for determining the levels of miR-125b. (B) Reduced expression of CCL4 mRNA (N = 9) and (C) protein (N = 12) in miR-125b enriched naïve CD8 T cells as compared to control cells. Supernatants were collected after 16 h stimulation with anti-CD3 and anti-CD28 from transfected cells. The data were log transformed and presented as mean and SEM. Paired Student t-test was used (** P < 0.01). The concentration of CCL4 protein ranges from 0.2 to 12 ng/mL.
