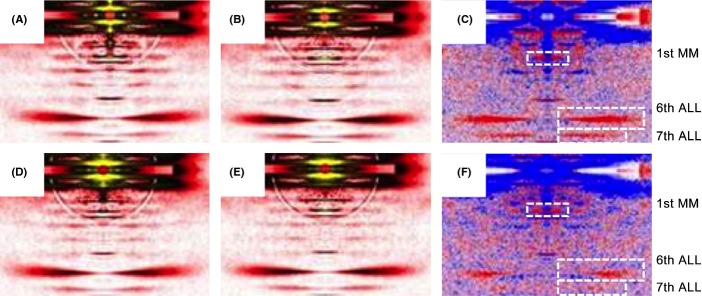
Figure 2.

X-ray diffraction patterns Low angle X-ray diffraction reflections. X-ray diffraction patterns of fibers from young (first row: A, B, and C) and older individuals (second row: D, E, and F), in pre-activating (pCa 9.0, first column: A and D) and activating (pCa 4.5, second column: B and E) solutions. There are also differences in intensity profiles (third column: C and F); red and blue colors indicate the enhanced and weakened areas, respectively, after addition of calcium. MM, myosin meridional; ALL, actin layer line.
