
Figure 2.
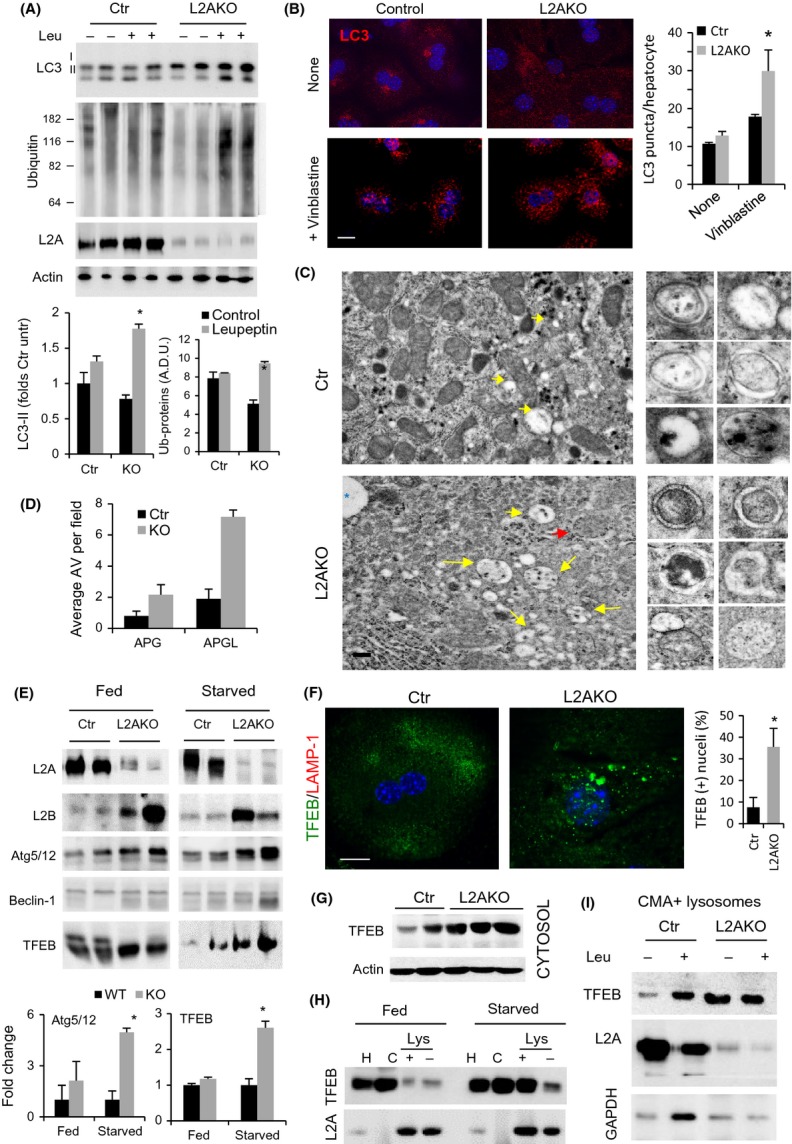
Macroautophagy compensates for CMA failure in young mice livers. (A) IB of liver homogenates from 4-month-old Ctr and L2AKO mice i.p. injected with leupeptin 2 h prior tissue dissection. Bottom: quantification, n = 4. (B) Immunofluorescence of LC3 in hepatocytes from Ctr and L2AKO mice treated or not with vinblastine. Right: quantification of average puncta per cell, n = 6 (scale bar: 10 μm). (C) Ultrastructure of livers from Ctr and L2AKO mice. Arrows indicate autophagosomes (APG, red) or autophagolysosomes (APGL, yellow). Inserts on the right show examples of both types of vesicles. Additional fields are shown in Fig. S2A. (scale bar: 5 μm) (D) Morphometric quantification of APG and APGL,n = 4. (E) IB for a panel of macroautophagy-related proteins of livers homogenates from fed or 24 h starved Ctr and L2AKO mice. Bottom: densitometric quantification, n = 4. (F) Immunofluorescence for TFEB (green) in primary hepatocytes isolated from 4-month-old Ctr and L2AKO mice (scale bar: 10 μm). Right: quantification of percentage of cells with nuclear TFEB signal, n = 6. Full filed images are shown in Fig. S2C. (G) IB for TFEB in cytosolic fractions from Ctr and L2AKO mice. (H) IB of homogenates (H), cytosol (C), and lysosomes active (+) or inactive (−) for CMA isolated from livers of fed or 24 h starved Ctr and L2AKO mice. (I) IB of isolated lysosomes active for CMA (CMA+) isolated from livers of Ctr and L2AKO mice treated or not with leupeptin 2 h prior tissue dissection. All values are expressed as mean ± SEM. Differences are significant for *P < 0.05.