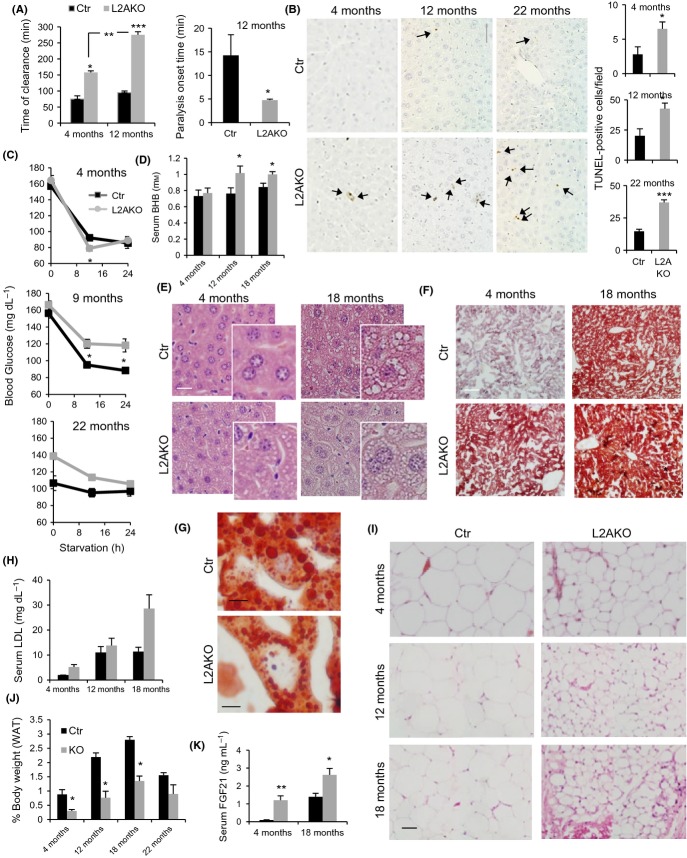
Figure 5.
Metabolic changes in CMA-deficient mice with age. (A) Time of clearance (left) and onset of paralysis (right) measured in 4- and 12-month-old control (Ctr) and Albumin-Cre:L2Af/f (L2AKO) mice after zoxazolamine i.p. injection, n = 4. (B) TUNEL staining of livers from 4-, 12-, and 22-month-old Ctr and L2AKO mice, scale bar 60 μm (1/4 of full field is shown to appreciate details). Arrows indicate TUNEL-positive cells. Right: quantification of 10 different non-overlapping fields, n = 3. (C) Basal and fasting blood glucose levels in 4-, 9-, and 22-month-old Ctr and L2AKO mice, n = 3–6. (D) Serum ketone bodies (beta-hydroxybutyrate) in 24 h starved Ctr and L2AKO mice at indicated ages, n = 4–8. (E,F) Livers from 24 h starved Ctr and L2AKO mice at the indicated ages were stained with H&E (E) or oil red O (ORO) (F) (scale bar, 40 μm). (G) Magnification of ORO-stained 18-month-old Ctr and L2AKO livers to show lipid droplet size. (H) Serum LDL in 24 h starved Ctr and L2AKO mice at indicated ages, n = 4–8. (I) H&E of perigonadal white adipose tissue (WAT) from 24 h starved mice of the indicated ages (scale bar, 100 μm). (J) WAT weight from the same animals, n = 3–4. (K) Serum FGF21 levels in 24 h starved Ctr and L2AKO mice, n = 5–8. All values are expressed as mean ± SEM. Differences are significant for *P < 0.05; **P < 0.01, and ***P < 0.001.

