
Figure 5.
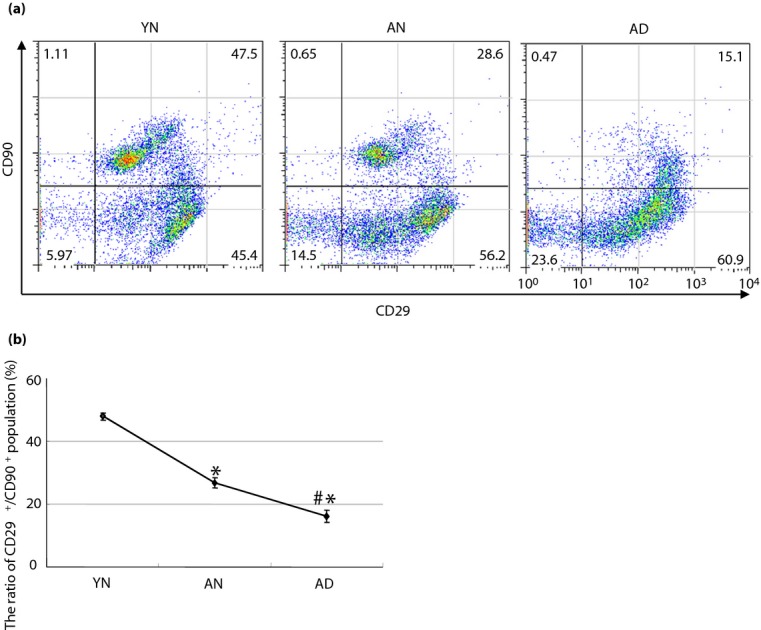
Change of subpopulation in bone marrow-derived mononuclear cells. Fluorescence-activated cell sorter analysis showed a change of subpopulation among bone marrow-derived mononuclear cells derived from the young non-diabetic (YN), adult non-diabetic (AN) and adult diabetic rats (AD). (a) Representative figures of fluorescence-activated cell sorter analysis in each bone marrow-derived mononuclear cell. (b) The CD29+/CD90+ population decreased in AN (26.8 ± 1.6%) or AD (16.3 ± 1.9%) compared with YN (48 ± 1.1%). (a,b) Furthermore, the population decreased significantly in AD compared with AN. *P < 0.05 vs YN, #P < 0.05 vs AN.