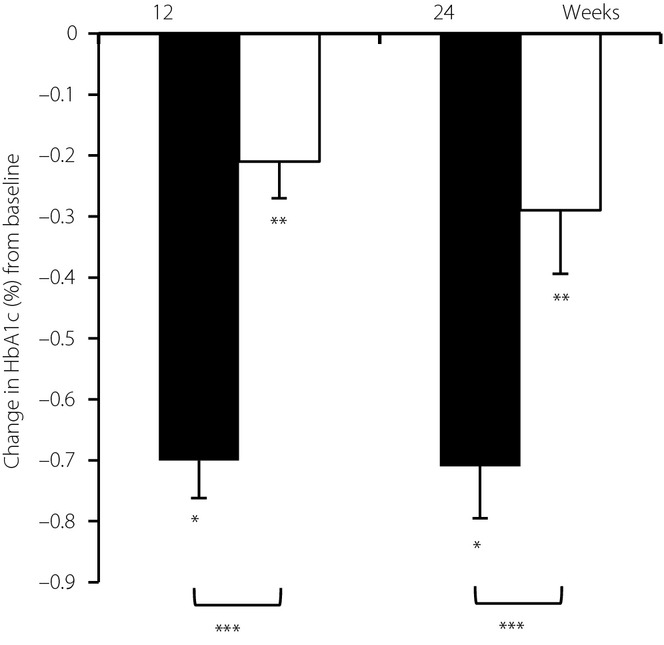
Figure 2.

Changes in glycated hemoglobin (HbA1c) from baseline with the sitagliptin group (black bars) and α-glucosidase inhibitors group (white bars) at week 12 and 24. Error bars represent standard error. *P < 0.05 from baseline (sitagliptin group). **P < 0.05 from baseline (α-glucosidase inhibitors group). ***P < 0.05 between sitagliptin and α-glucosidase inhibitors with the same week.
