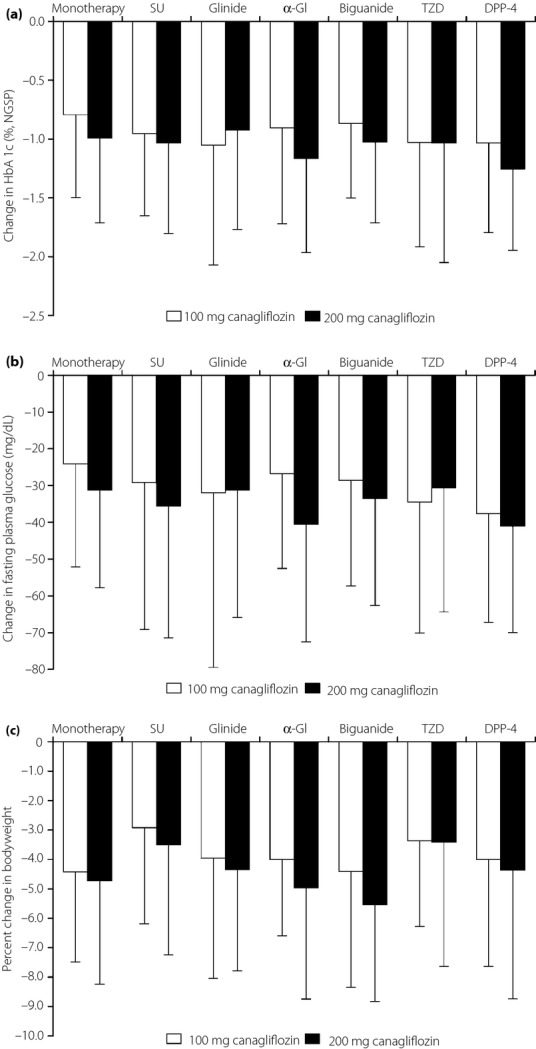
Figure 2.

Changes in (a) hemoglobin A1c (HbA1c), (b) fasting plasma glucose and (c) bodyweight from baseline to the end of treatment with last observation carried forward. Light bars, 100 mg canagliflozin; dark bars, 200 mg canagliflozin. Values are means ± standard deviation. α-GI, α-glucosidase inhibitor; DPP-4, dipeptidyl peptidase-4 inhibitor; NGSP, National Glycohemoglobin Standardization Program; SU, sulfonylurea; TZD, thiazolidinedione.
