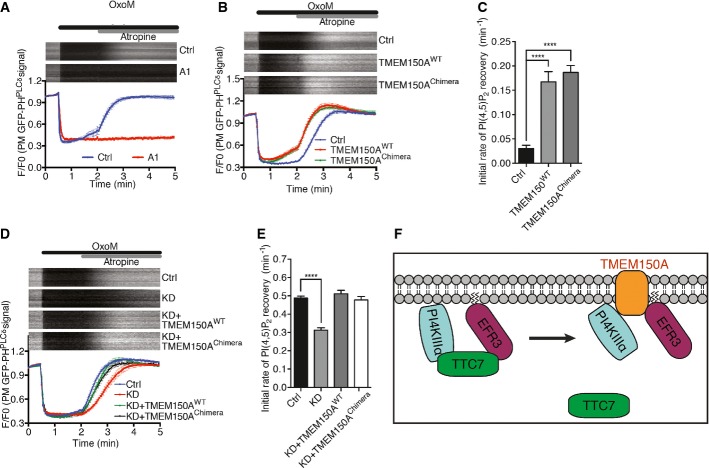
A Time course of GFP fluorescence, as assessed by TIRF microscopy, from HeLa cells transfected with GFP-PHPLCδ and muscarinic receptor (M1R) and pretreated with compound A1 (100 nM) for 10 min. Oxo-M (10 mM) and atropine (50 mM) were added at the indicated times. Kymographs of representative cells (top) and normalized average traces (bottom; n ≥ 10) are shown. Quantitative data are represented as mean ± SEM.
B Time course of GFP fluorescence as in (A) from HeLa cells expressing the indicated proteins together with GFP-PHPLCδ and M1R.
C Bar graph showing initial rate of PI(4,5)P2 recovery (before atropine) from (B), represented as mean ± SEM (n ≥ 10). Statistical significance was assessed by Student's t-test. ****P < 0.0001.
D Time course of normalized GFP fluorescence, as in (A) from HeLa cells expressing the indicated proteins together with GFP-PHPLCδ and M1R, and in addition treated with control TMEM150A-specific siRNA 24 h prior to other transfection.
E Bar graph showing initial rate of PI(4,5)P2 recovery (after atropine) from (D), represented as mean ± SEM (n ≥ 10). Statistical significance was assessed by Student's t-test. ****P < 0.0001.
F Schematic representation of PI4KIIIα interactions at the plasma membrane. TTC7 interacts directly with both PI4KIIIα and EFR3. The presence of TMEM150A in a complex comprising PI4KIIIα is mutually exclusive to the presence in the complex of TTC7. The interactions of TMEM150A shown at the right were demonstrated biochemically and result in a positive regulation of PI4KIIIα but may be indirect.

