
Figure 2.
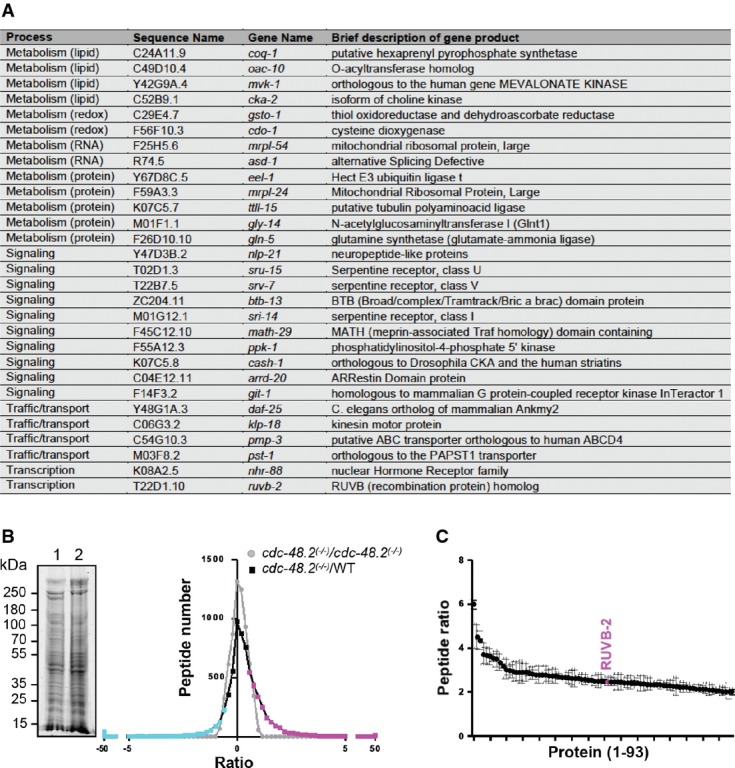
Identification of RUVB2 as a candidate CDC-48 target
- A List of RNAi clones suppressing the cdc-48.2(−/−) phenotype.
- B Graph representing identified peptide number identified in function of peptide quantity ratio. cdc-48.2(−/−); ckb-2::gfp and ckb-2::gfp synchronized L1 larvae were grown to the L4 stage and exposed to tunicamycin (5 μg/ml) for 16 h on plates. Proteins (60 μg) were separated on a 10% SDS gel. A coomassie blue staining image representative of the SDS gel is shown on the left (1: cdc-48.2(−/−); ckb-2::gfp, 2: ckb-2::gfp). Gel lanes were cut into slices before proteins were in-gel-digested. Peptides were then identified and quantified by label-free LC-MS/MS mass spectrometry. Peptides that were more (magenta) or less (cyan) abundant in the cdc-48.2(−/−); ckb-2::gfp than in ckb-2::gfp worms were defined as those having a ratio above 1.5 or below 0.5, respectively. N + 3.
- C Graph representing peptide quantity ratio ((cdc-48.2(−/−); ckb-2::gfp)/(ckb-2::gfp)) for the 93 proteins that are more abundant in cdc-48.2(−/−) mutant background compared to WT background. (Mean ± s.e.m, N + 3).