Figure 2.

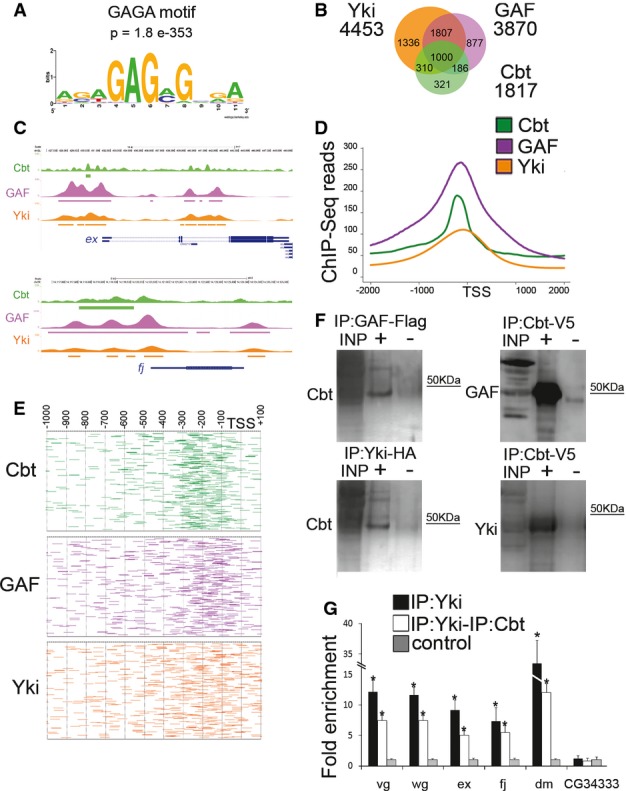
- A Motif and significance score for GAF DNA-binding protein at Cbt-bound targets. De novo analysis with MEME-ChIP identified GAF motif (GAGA) as one of the most representative motifs enriched within Cbt binding regions.
- B Venn diagram showing the overlap between Cbt (green), GAF (purple) and Yki (orange) in the promoters of their target genes.
- C UCSC Genome Browser overview of Cbt (green), GAF (purple) and Yki (orange) ChIP-Seqs in ex and fj regions. Peaks are represented as boxes in different colors: Cbt (green), GAF (purple) and Yki (orange).
- D Distribution of Cbt (green), GAF (purple) and Yki (orange) ChIP-Seq reads over the TSS of common target genes.
- E Distribution of Cbt (green), GAF (purple) and Yki (orange) location in the promoters of their target genes.
- F Western blots showing proteins immunoprecipitated from S2 cells transfected with Yki-HA, GAF-Flag or Cbt-V5 cells and detected by anti-Cbt, anti-GAF and anti-Yki antibodies. Input (INP), immunoprecipitated samples (+) and negative control (−).
- G ChIP-reChIP of Yki-HA and Cbt from S2 cells tested by real-time PCR. The order of antibodies is Yki-HA ChIP and Cbt. Yki-HA ChIP (black), ChIP-reChIP (white). CG34333 promoter region was used as a negative bound region, and results were normalized against input and the mock sample (negative control, gray) and are depicted as fold enrichment. Error bars represent fold enrichment error. T-test (*)P ≤ 0.05, n + 3.
Source data are available online for this figure.
