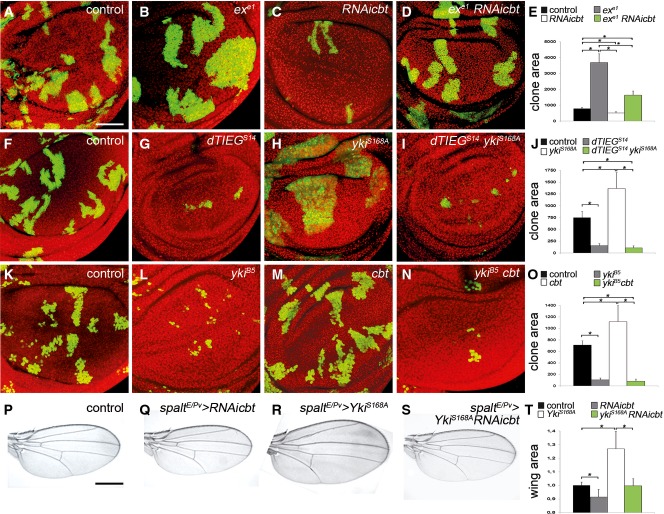
Figure 4.
- A-E Wing disks containing GFP-marked MARCM clones of the exe1 mutant allele (B), cbt RNAi (C) and exe1 mutant clones with cbt RNAi (D). Scale bar + 50 µm. (E) Quantification of clone area of control (black), ex mutant (gray), cbt RNAi (white) and ex e1 clones with cbt RNAi (green). Error bars represent SEM. T-test (*)P ≤ 0.003, n + 10.
- F-J Wing disks containing GFP-marked MARCM clones of the dTIEGS14 mutant allele (G), YkiS168A overexpression (H) and dTIEGS14 mutant clones with ykiS168A overexpression (I). (J) Quantification of clone area of control (black), cbt mutant (gray), yki overexpression (white) and cbt mutant with yki overexpression (green). Error bars represent SEM. T-test (*)P ≤ 0.0003, n + 10.
- K-O Wing disks containing GFP-marked MARCM clones of the ykiB5 mutant allele (L), cbt overexpression (M) and ykiB5 mutant clones with cbt/dTIEG overexpression (N). (L) Quantification of clone area of control (black), yki mutant (gray), cbt overexpression (white) and yki mutant with cbt overexpression (green). Error bars represent SEM. T-test (*)P ≤ 0.004, n + 10.
- P-T Wings expressing cbt RNAi (R), ykiS168A (Q) and ykiS168A with cbt RNAi (S) under spaltE/Pv promoter for 24 h. Scale bar + 0.5 mm. (T) Quantification of wing area of control (black) cbt RNAi (gray), ykiS168A (white) and cbt RNAi with yki (green). Error bars represent SD. T-test (*)P ≤ 0.00001, n + 50.

