
Figure 1.
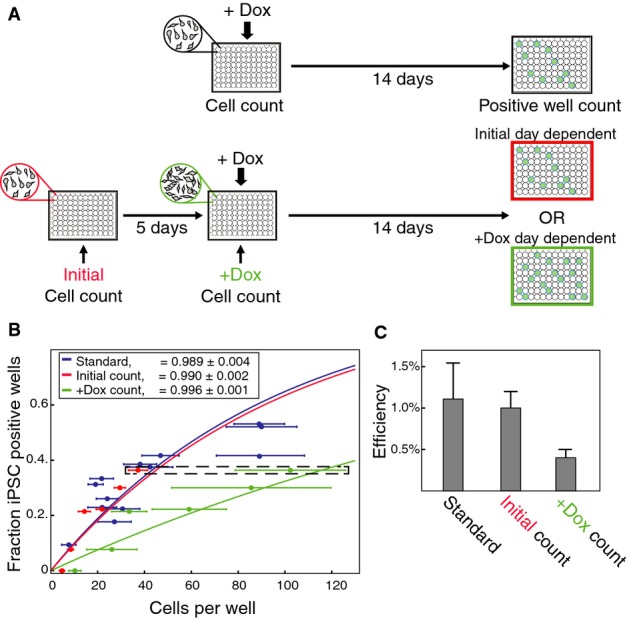
The potential to reprogram is determined prior to factor induction
- A Schematic of the Luria–Delbrück inspired experiment. Doxycycline (dox) was administered after either no delay or 5 days following plating. Cells in each well were counted both after plating and at dox induction. The number of GFP+ wells at the end of 14 days was used to distinguish between different potential acquisition models (see text).
- B Reprogramming efficiencies measured as fraction of wells with GFP+ colonies as a function of cells per well. Dark blue mark denotes mean and standard deviation of one 96-well plate experiment where dox was administered immediately after plating. Red and green marks denote wells that were induced to reprogram 5 days after plating binned according to their cell number as demonstrated in Supplementary Table S1. For each group: red mark, initial cell count; green mark, cell count at day of dox induction. A pair of marks with the same y-value corresponds to the same group of wells. The dashed box highlights the specific wells exemplified in Supplementary Table S1. The solid curve of each color represents the theoretical efficiency for the corresponding reprogramming probability parameter, calculated as the maximum-likelihood estimator according to each data set separately (see Supplementary Text S2). The data are based on two independent experiments.
- C Reprogramming efficiency parameters corresponding to the three models shown in (B). Error bars represent standard deviation computed using sample bootstrapping (see Supplementary Text S2). Efficiency computed from initial count is more similar to the standard than that computed from count at day of dox induction.