
Figure 4.
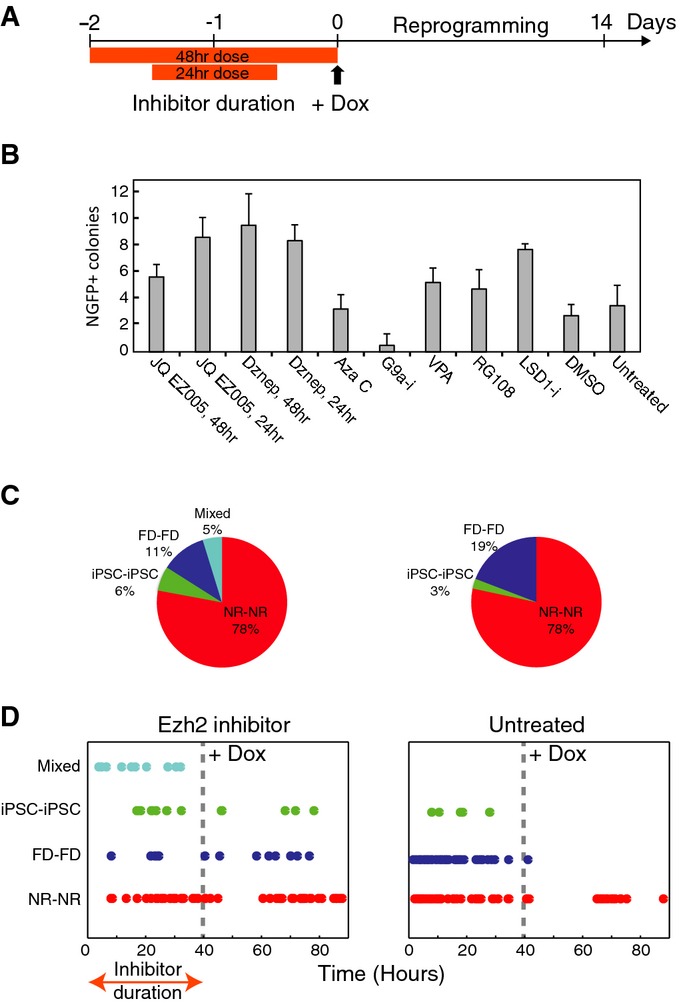
Reducing H3K27 or increasing H3K4 methylation prior to OSKM induction increases per-lineage reprogramming potential
- A Schematic of inhibitors experiment. Inhibitors were added during the 48 h preceding dox induction, for either 24 or 48 h.
- B Effect of pre-treatment with different inhibitors on reprogramming efficiency. Shown are mean and standard deviation for imaged colony counts over 6 replicate wells (see counting procedure in Materials and Methods).
- C Fraction of lineage pairs with each corresponding fate combination after transient Ezh2 inhibition in the somatic population (left) or after no treatment (right, taken from Fig2).
- D Time of first division for the different lineage pairs under Ezh2 pre-dox inhibition (left) or no treatment (right).