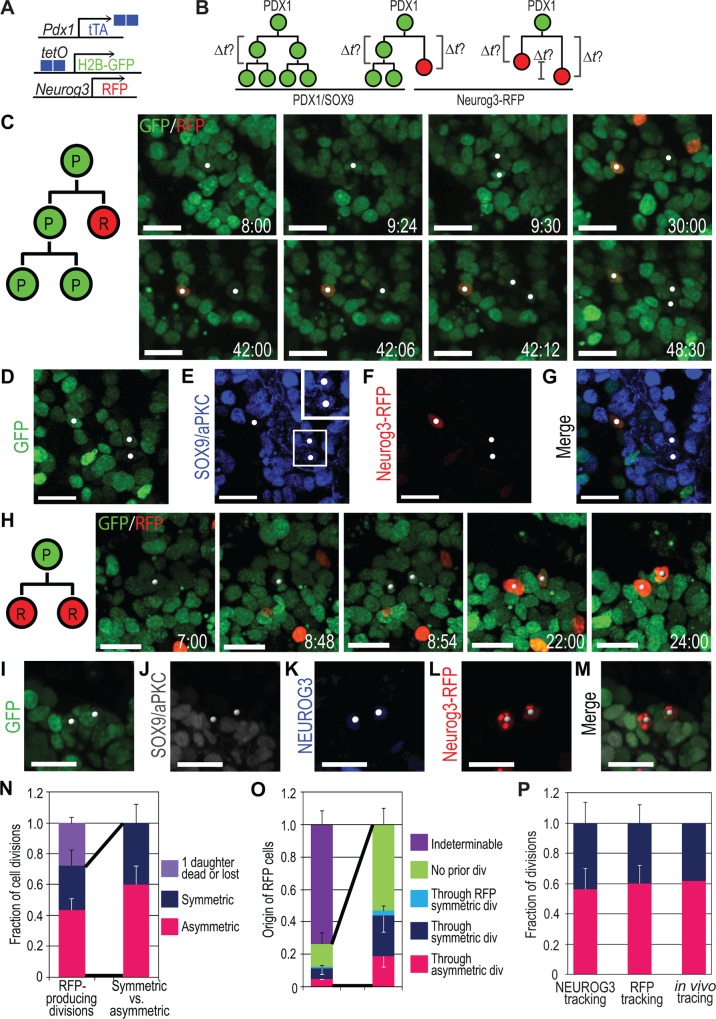
Fig 3. Extended live imaging with Neurog3-RFP reporter reveals the dynamics of progenitor cell cycle and differentiation.
(A) Scheme summarizing the genetic strategy to visualize PDX1+ pancreatic progenitors and NEUROG3 + endocrine progenitors for live imaging. (B) Model of pancreatic progenitor divisions with a Neurog3-RFP reporter. After second division of self-renewing progenitors, cell cycle length can be obtained. Using the Neurog3-RFP reporter, endocrine differentiation timing and synchrony can be obtained. (C) Still images from S6 Movie, demonstrating an asymmetric (P/R) division producing one Neurog3-RFP+ daughter and two other granddaughters (white spots) from a Pdx1 tTA/+;tetO-H2B-GFP;Neurog3-RFP explant. After the first division, one daughter turns on RFP (before elapsed time 30:00), and later the other daughter divides, producing two granddaughters (at elapsed time 42:12). (D-G) Images of fixed explant with native GFP (D) and immunostained for SOX9/aPKC (E) and Neurog3-RFP (F, staining for MYC-tag). White spots correspond to cells in (C), and one is RFP+ and two granddaughters are SOX9+ (E,F). Inset in (E) shows high magnification image of SOX9 staining. (H) Still images from S7 Movie, demonstrating a symmetric (R/R) division producing two Neurog3-RFP+ daughters (grey spots). After the division, both daughters turn on RFP. (I–M) Images of fixed explant with native GFP (I) and immunostained for SOX9/aPKC (J), NEUROG3 (K), and Neurog3-RFP (L, staining for MYC-tag). Both daughters are NEUROG3+/RFP+. (N) Fraction of RFP-producing cell divisions. Each category (pink, blue, and purple bars) was counted from three movies. (O) Analysis of RFP emergence from three live imaging movies. In three cases, RFP+ cells divided producing two RFP+ cells each (cyan bar), and the majority of RFP+ cells were either lost or moved out of frame during back-tracking (indeterminable, purple bar). (P) Fraction of asymmetric versus symmetric cell divisions from three different measurements: NEUROG3 tracking, Neurog3-RFP tracking, and in vivo clonal analysis. All three measurements exhibit equivalent rates of divisions. Numbering denotes elapsed time in h:min, and in the cell division diagrams P indicates progenitor and R, Neurog3-RFP (C, H). Scale bars, 20 μm. Histograms and error bars represent the mean and standard deviation (n = 3). See S6 Table for further data.

