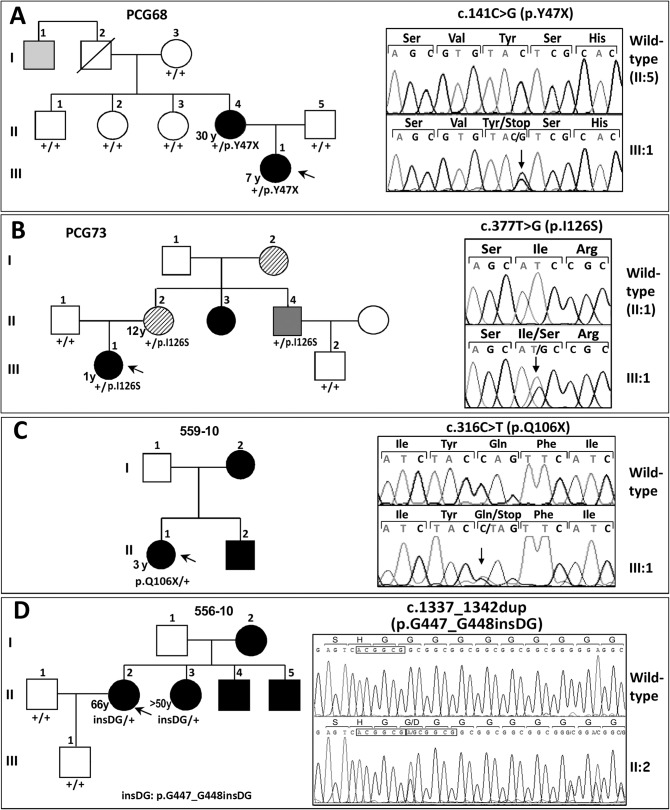
Fig 1. FOXC1 mutation segregation in families with autosomal dominant glaucoma.
(A, B, C and D) Pedigrees of the families. The numbers in the inferior left side of the symbols indicate age at diagnosis. The oblique lines represent dead subjects. Black, dark grey and light grey symbols indicate glaucoma, Axenfeld-Rieger anomaly and ocular hypertension, respectively. The arrows in the pedigrees show the index cases. +: wild-type allele. The insets in each panel correspond to the electropherograms of the FOXC1 mutations identified in each family. To facilitate the comparison, the wild-type sequence is shown above the corresponding mutant sequence. All the mutations were detected in the heterozygous state. Arrows in the electropherograms indicate the location of mutations. Duplicated nucleotides in panel D inset are indicated by boxes.

