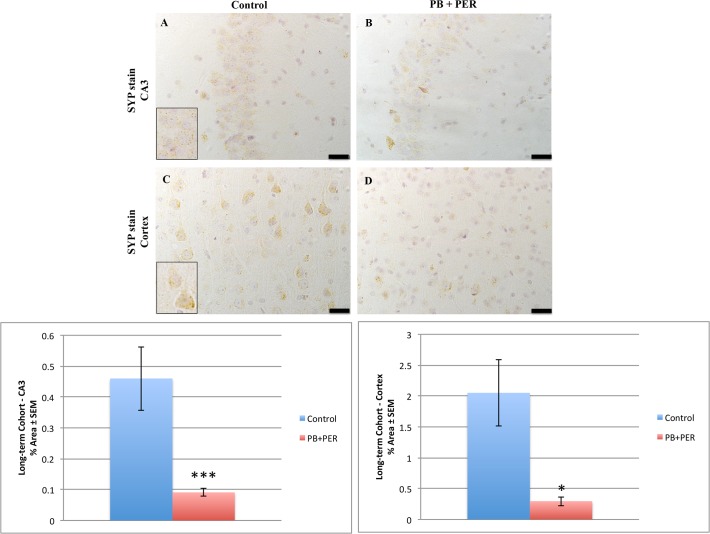
Fig 6. PB + PER exposure decreased SYP staining in the hippocampi and cerebral cortices of exposed mice.
Differences in SYP staining was observed in the CA3 region of exposed mice (B) versus controls (A) at 5 months post exposure (Welch’s t-test = 12.7, DF = 1, p < 0.01). In addition, significantly reduced SYP staining was evident in the cerebral cortices of exposed mice (D), as compared to controls (C) (Welch’s t-test = 10.26, DF = 1, p = 0.03). Representative images were taken at 60X magnification (scale bars represent 1 mm). Inset depicts positive SYP staining showing dark brown pre-synaptic vesicles stained within the cell soma (see insets in A and C). Histograms depict the quantification of the SYP stain in the hippocampi, and cerebral cortices, as % Area per microscopic field, and error bars represent standard error of the mean (SEM).

