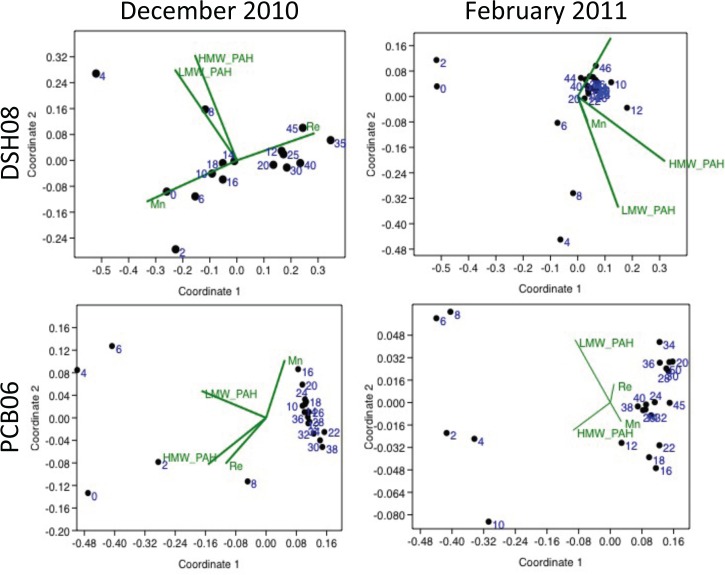
Fig 4. Non-metric multidimensional scaling plots for each core, where black dots represent the foraminiferal density at each sample interval (depths labeled in blue) and green vectors represent each environmental variable (HMW PAH, LMW PAH, Re, Mn)[28,29].
The Euclidian distance between each sample depth represents the Bray Curtis similarity and the orientation and length of the green vectors represent the correspondence and intensity of each environmental parameter to the variability between foraminiferal density.

