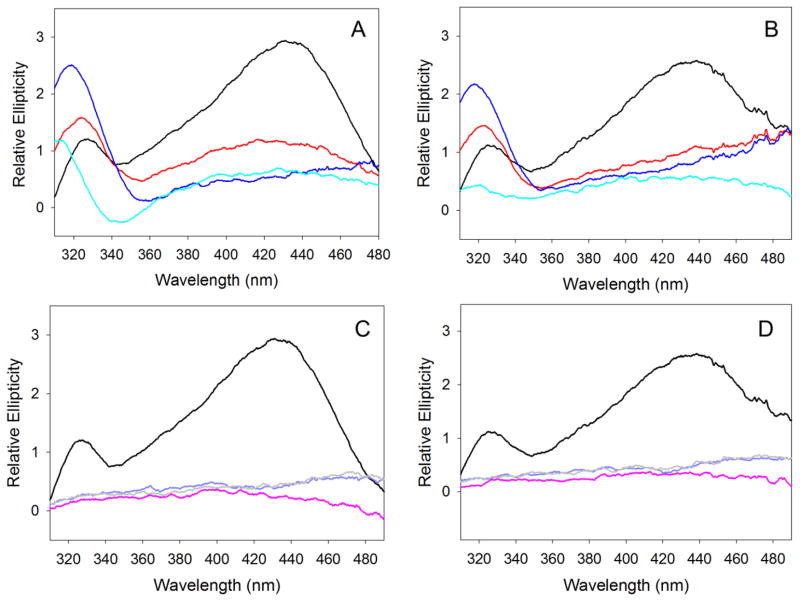
Figure 5.
Effects of pH and temperature on the chiral active site environment of the mALAS2 internal aldimine. CD spectra in the 500-310 nm region collected at (A) alkaline pH and 20 °C, (B) alkaline pH and 37 °C, (C) acidic pH and 20 °C, (D) acidic pH and 37 °C. The colors of the spectra correspond to: pH 1 (pink), pH 2 (purple), pH 3 (gray), pH 7.5 (black), pH 8.5 (red), pH 9.5 (blue), and pH 10.5 (cyan).

