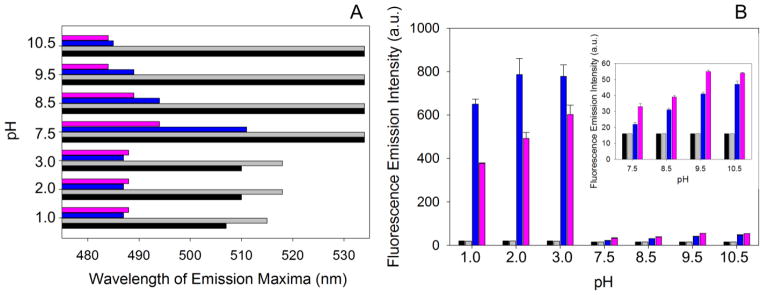
Figure 6.

Reaction between ANS and mALAS2 at different pH values at 20 or 37 °C. (A) Wavelength of emission maxima. (B) Fluorescence emission intensity. The colors correspond to: free ANS at 20 °C (black), free ANS at 37 °C (gray), ANS in the presence of mALAS2 at 20 °C (blue), and ANS in the presence of mALAS2 at 37 °C (pink).
