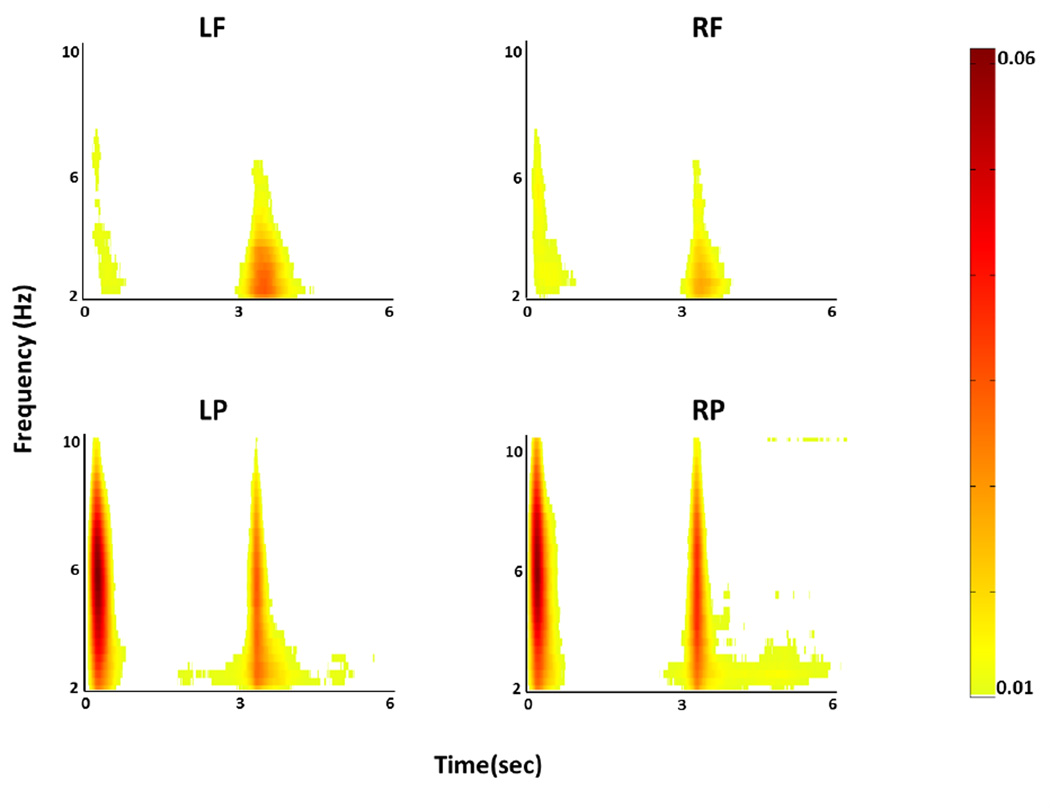
Figure 4. Average of ERS over ROIs for all subjects.
Each time-frequency ERS plot (time: x-axis, frequency: y-axis) represents averaged increase in energy of all EEG signals of each ROI, for all subjects. ERS seen immediately following Prepare (0–1 sec) does not differ in magnitude between left and right hemispheres. Following Go (3–4 sec), ERS in the left frontal ROI was significantly greater in magnitude than ERS in the right frontal ROI. n.s. = non-significant. This asymmetry can also be seen in Figure 3.

