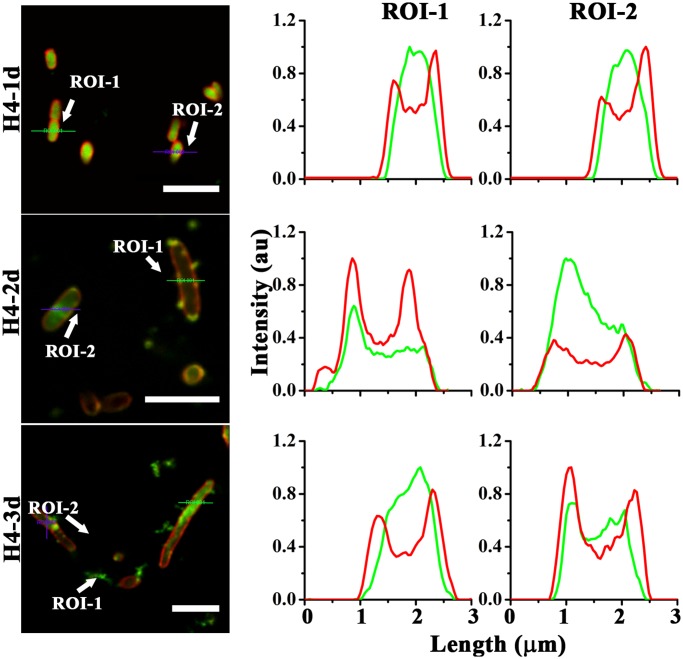
Fig 4. Localization of analogs in E. coli.
Fluorescence intensity due to CF-peptide and FM4-64, represented by green and red color respectively was monitored along the line drawn across the bacterial morphology indicated by white arrows and signifies as region of interest (ROIs). Scale bars represent 5 μm.

