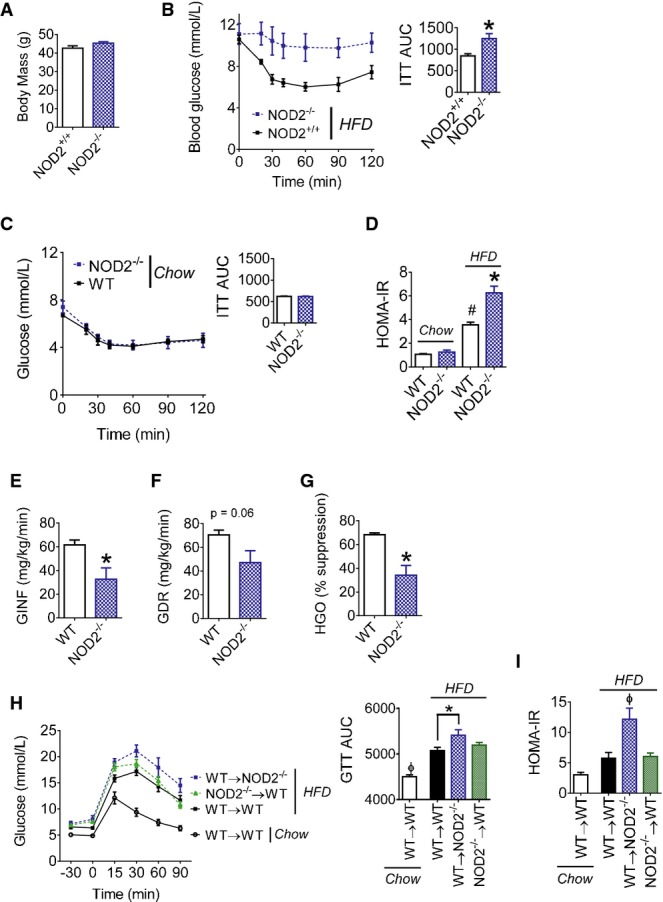
NOD2 deletion in mice exacerbates diet-induced insulin resistance
A, B Body mass (A), blood glucose, and the cumulative area under the curve (AUC) (B) during insulin tolerance tests (ITT; 1.0 IU/kg i.p.) in NOD2+/+ (n = 8) and NOD2−/− (n = 10) littermate mice fed a HFD for 16 weeks, *P = 0.001.
C Blood glucose and the cumulative AUC during insulin tolerance tests (ITT; 0.5 IU/kg i.p.) in chow-fed WT (n = 6) and NOD2−/− (n = 6) mice.
D HOMA insulin resistance (IR) index in weight-matched chow- (n = 7) or HFD-fed (n = 10) WT and NOD2−/− mice, #P = 0.0001 (WT chow versus WT HFD) and *P = 0.0001 (WT HFD versus NOD2−/− HFD).
E, F Glucose infusion rate (GINF) (E) and glucose disposal rate (GDR) (F) during hyperinsulinemic euglycemic clamps in weight-matched WT (n = 4) and NOD2−/− (n = 3) mice fed a HFD for 16 weeks, *P = 0.02.
G Percentage of hepatic glucose output (HGO) suppression during hyperinsulinemic euglycemic clamps in weight-matched WT (n = 4) and NOD2−/− (n = 3) mice fed a HFD for 16 weeks, *P = 0.005.
H Blood glucose and cumulative AUC during glucose tolerance tests (GTT; 1.0 g/kg) in chow-fed (n = 3) or HFD-fed WT and NOD2−/− mice (n > 8 for all groups) after bone marrow transplantation, *P = 0.04 and ϕP = 0.01.
I HOMA-IR in chow-fed (n = 3) or HFD-fed WT and NOD2−/− mice (n > 8 for all groups) after bone marrow transplantation, ϕP = 0.003.
Data information: *Significantly different from HFD-fed NOD2
+/+ or WT mice or as indicated.
#Significantly different from WT chow-fed mice.
ϕSignificantly different from all other conditions. An unpaired
t-test was used for comparisons between two conditions, whereas a 1-way ANOVA was used for comparisons between more than two conditions. Tukey's post-hoc test was used. Values are mean ± SEM.

