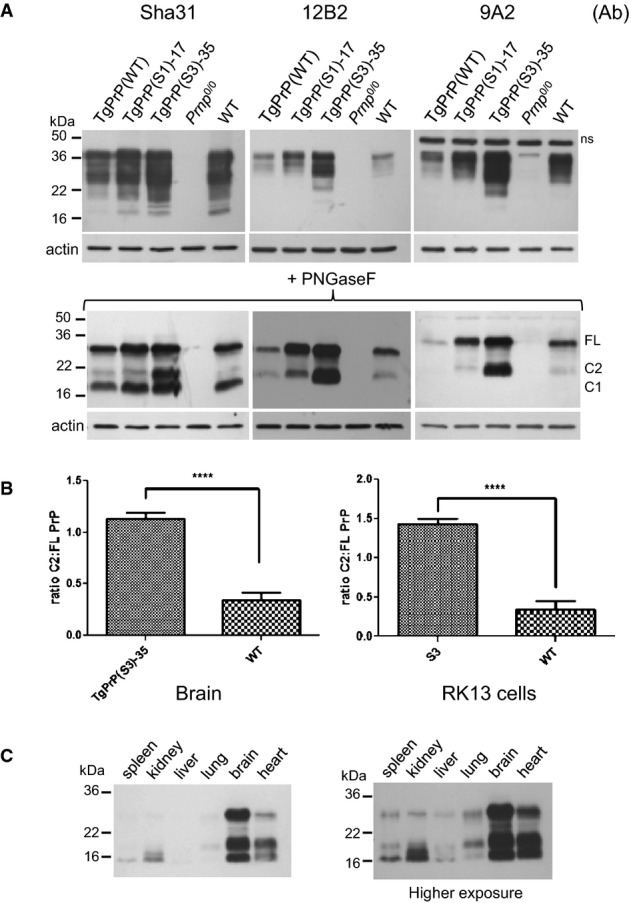
Figure 3.

- A Brain homogenates of TgPrP(WT), TgPrP(S1)-17 and TgPrP(S3.F88W)-35 mice were analysed by Western blot before and after PNGaseF digestion using the PrP antibodies Sha31, 12B2 and 9A2. Prnp0/0, and WT brain homogenates were used as controls.
- B The ratio of C2 to full-length PrP in TgPrP(S3.F88W)-35 and WT mice (left panel, n = 7, P = 1.46E-06) and in RK13 cells expressing WT and S3 PrP (right panel, n = 5, P = 4.01E-05) is shown. Values are presented as mean ± SEM. Unpaired, two-tailed t-test, ****P < 0.0001.
- C Different tissue homogenates from a TgPrP(S3.F88W)-35 mouse were PNGaseF-digested and analysed for PrP using the antibody 1A6. FL, full-length PrP; ns, non-specific signal detected in the immunoblotting procedure.
