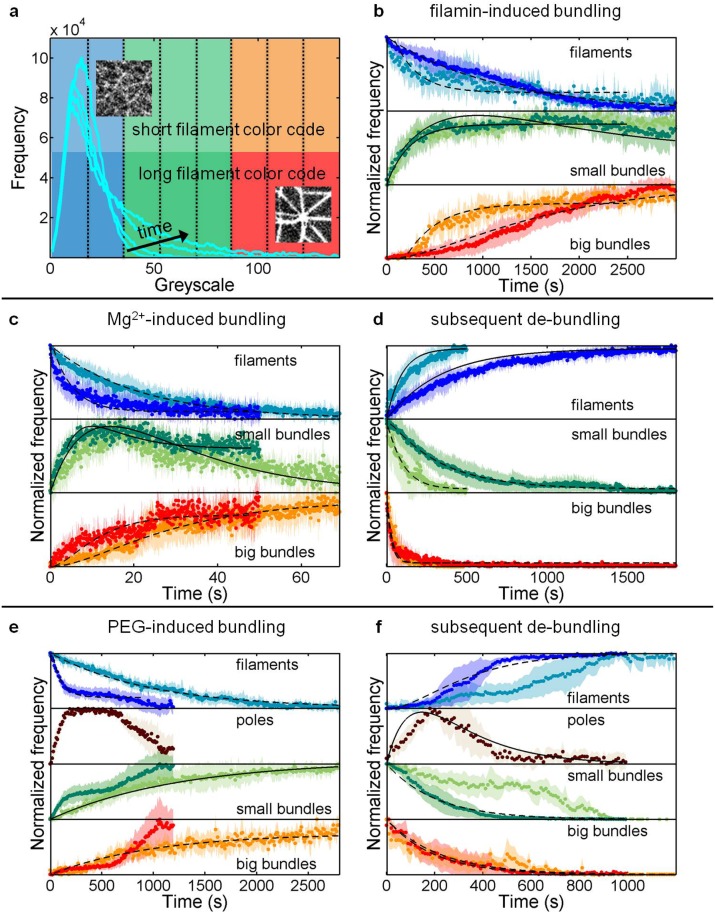
Fig 5. Evolution of filaments, small bundles and big bundles during the assembly and subsequent disassembly processes induced by counterion condensation, depletion interactions and specific binding interactions.
(a) Typical frequency histograms (cyan) of greyscale values of the fluorescence images during the bundling process. The greyscale is divided into eight equal slices (indicated by vertical dotted lines) from which the evolution of the reaction components (b-f) is obtained. Similar scenario is applied to the de-bundling processes. (b, c, e) Evolution of reaction components during bundling induced by filamin (n = 12), Mg2+ ions (n = 21) and PEG polymers (n = 13), respectively. (d, f) Evolution of reaction components during de-bundling of networks (and clusters) induced by Mg2+ ions (n = 14) and PEG polymers (n = 13), respectively. The darker shades in each sub-graph correspond to network reactions while the lighter shades correspond to cluster reactions. The shaded areas indicate the errors (± standard deviation). The dotted lines are fits to the data sets as described in S2 Text. Solid lines are subsequently derived from the obtained rate constants.

