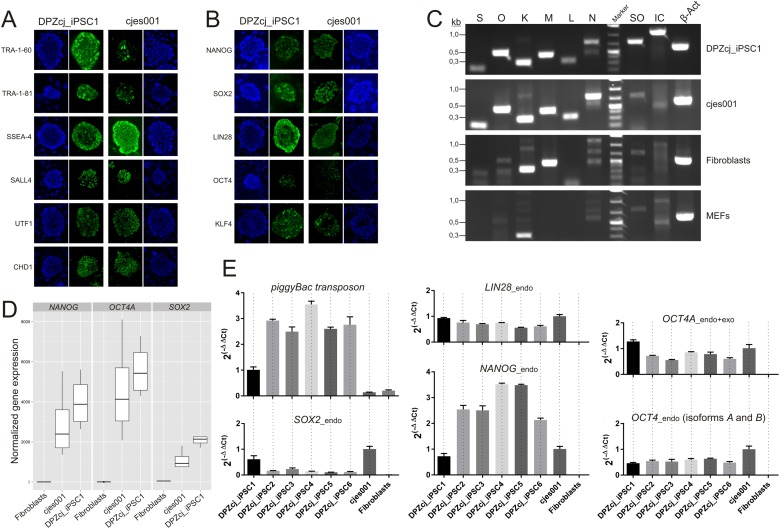
Fig 2. Expression of pluripotency markers.
A and B) Immunofluorescence staining of iPS cell colonies. Immunofluorescence shows similar expression of several pluripotency factors in the generated iPSCs and in the ES cell line cjes001 indicating reactivation of the endogenous pluripotency factors in the iPS cell line (left). Also expression of the reprogramming factors delivered by the piggyBac transposon is detectable. C) PCR analysis of the generated iPSCs for expression of endogenous reprogramming factors. Primer pairs specific for endogenous factors (S, O, K, M, L, N) or the reprogramming cassette (SO, IC) were used. Analysis was done with cDNA from the generated iPS cell line DPZcj_iPSC1, an established ES cell line (cjes001), primary fibroblasts and mouse feeder cells (MEFs). As loading control, a fragment of β-ACTIN was amplified. S, SOX2; O, OCT4; K, KLF4; M, c-MYC; L, LIN28; N, NANOG. The six reprogramming factors are expressed endogenously by the iPS cell line. As expected, KLF4 and c-MYC were also detected in cDNA from primary fibroblasts. Because of high sequence similarity, Klf4 was also amplified from mouse feeder cell cDNA. Expression of the reprogramming cassette was only detected in the iPSCs. D) Boxplot of NANOG, OCT4 and SOX2 normalized gene expression for fibroblasts, ESCs, and iPSCs. Only the pluripotency associated isoform of OCT4 (OCT4A) was selected for comparison, although the other transcript isoforms show similar expression profiles (data not shown). The upper whisker extends from the hinge to the highest value that is within 1.5 * IQR of the hinge, where IQR is the inter-quartile range, or distance between the first and third quartiles. The lower whisker extends from the hinge to the lowest value within 1.5 * IQR of the hinge. Boxplot generated by ggplot2 [51]. E) Real-time PCR for pluripotency markers expressed ectopically from the reprogramming cassette and endogenously. Levels of mRNA for the reprogramming cassette (Transposon), SOX2, LIN28, NANOG, and OCT4 in all six generated iPS cell lines (DPZcj_iPSC1–6) and in marmoset skin fibroblasts were compared to the levels in the established embryonic stem cell line cjes001. qPCR was performed on RNA isolated from triplicate cultures. The relative level ± SEM is shown for each cell line. To determine RNA levels of genes expressed endogenously, where possible, primer pairs were used with one of the primers annealing to an untranslated region of the mRNA.

