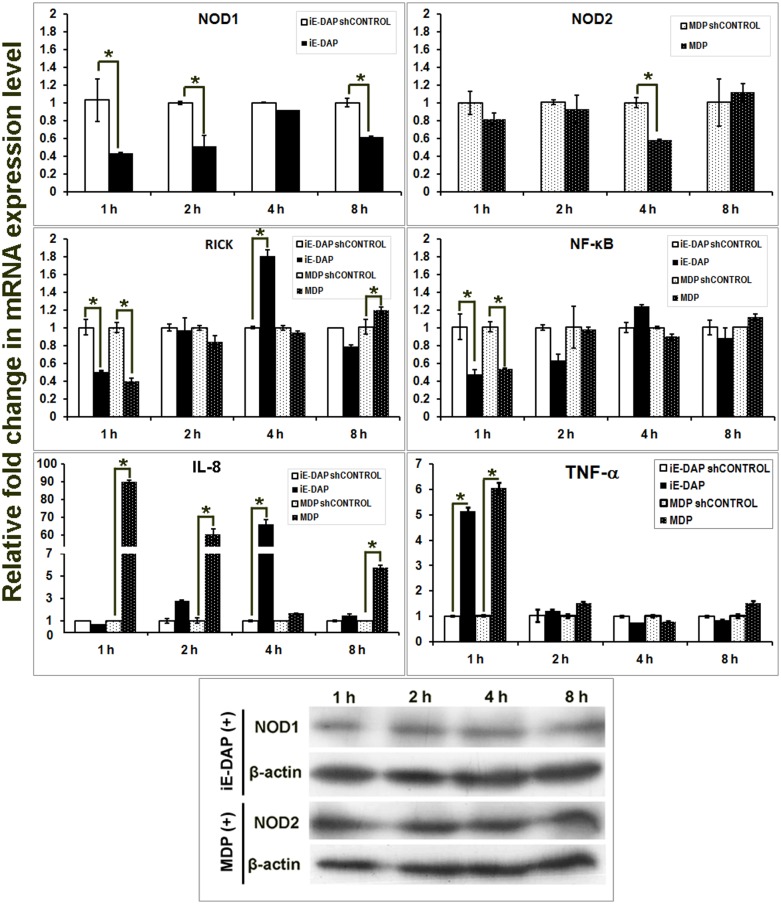
Fig 6. Inductive mRNA expression of NOD1, NOD2, RICK, NF-κB and IL-8 in iE-DAP and MDP treated mammary epithelial cell line of buffalo.
X-axis represents the time intervals following agonist addition, Y axis shows relative fold change in mRNA expression of genes over respective controls (sh-controls). Columns indicated with asterisks (*) differ significantly (p<0.05) from their respective controls. Protein expression of NOD1, NOD2 and β-actin in treated cells over different time intervals has been shown also.

