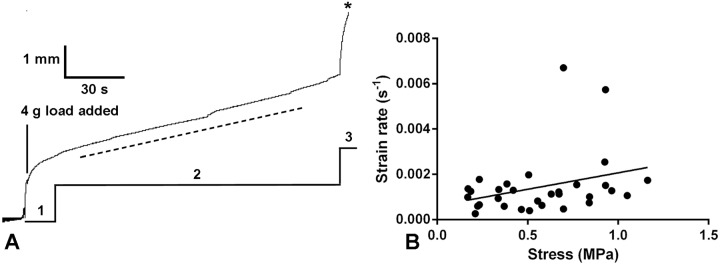
Fig 3. Creep behaviour of P. lividus CDs.

(A) Recording of a representative creep curve, showing the primary (1), secondary (2) and tertiary (3) phases, the last leading to rupture (asterisk). The dashed line indicates the slope of the secondary phase, from which the viscosity was calculated. (B) Relationship between strain rate during the secondary phase and stress. The best-fit line generated by linear regression is included (y = 0.0015x + 0.0006; Spearman r = 0.3076; P = 0.0924).
