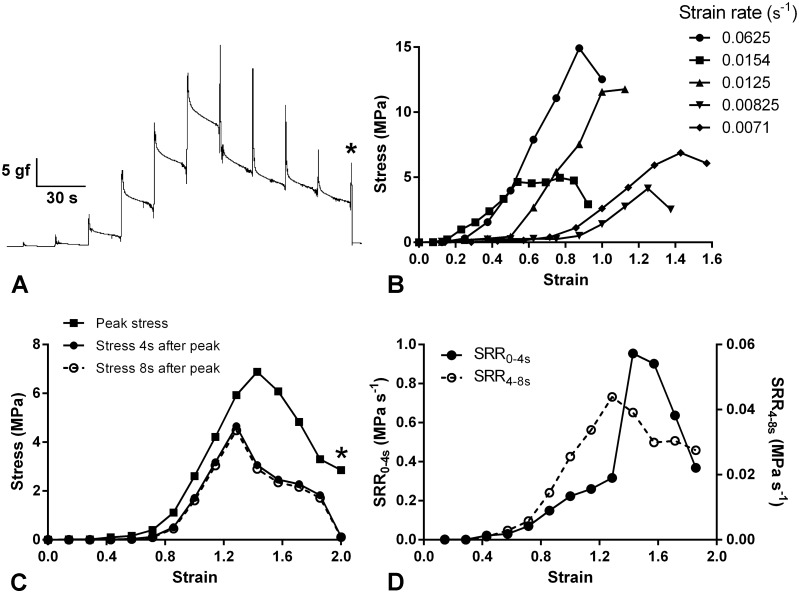
Fig 4. Force-extension and stress relaxation behaviour of P. lividus CDs.
(A) Recording of a representative force-extension test in which the CD was extended by 0.5 mm every 20 s. At each extension the force reached a peak then decayed in two phases (rapid and slow). The asterisk indicates the point at which rupture occurred. (B) Complete set of stress-strain curves derived from force-extension tests on five CDs from one animal. This set of curves is representative in terms of the apparent non-strain rate dependence of the duration of the toe region, the tensile strength and the breaking strain. For the sake of clarity, most of the curves are curtailed before the rupture point. (C) Stress-strain curves of one CD derived from the recording shown in Fig. 4A and which is one of the batch featured in Fig. 4B (strain rate 0.0071 s-1). Comparison of the curves for peak stress, stress 4 s after the peak was reached and stress 8 s after the peak was reached. Considerably more stress relaxation occurred in the 4 s after peak stress than in the subsequent 4 s. The asterisk indicates the point at which rupture occurred. (D) Stress relaxation data from Fig. 4C expressed as mean stress relaxation rates (SRR) during the periods 0–4 s and 4–8 s after each peak stress was reached.

