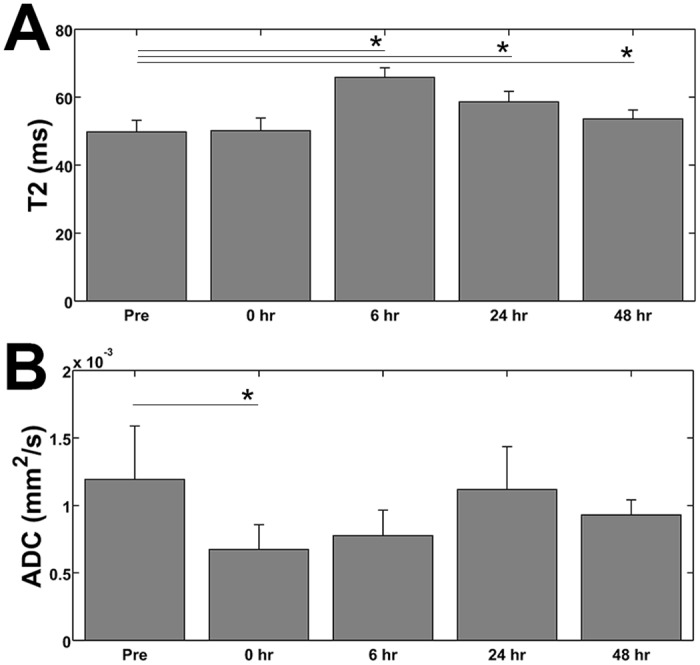
Fig 7. T2 and ADC values of the ablated region.

(A) The measured T2 values of the ablated region within the tumor illustrate an increase in T2 starting at 6 hours post treatment and remaining elevated, with respect to pre-ablation values, through 48 hours. (B) The change in the ADC at the ablated region/spot of the tumor shows a decrease immediately following treatment. The ADC remains slightly elevated through 48 hours, but we only found the decrease to be significant (compared to the pre-ablation values) at the 0 hr time point. *: p < 0.05.
