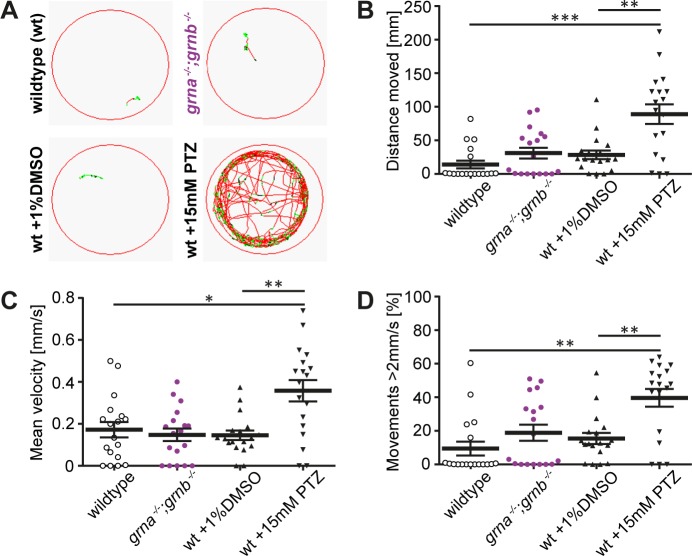
Fig 5. grna −/−;grnb −/− mutants swim like wildtype.
A: The swim path of wildtype, grna −/−;grnb −/− mutants, DMSO-treated, and PTZ-treated larvae is shown. PTZ treatment was used as a positive control. 5dpf. Movements < 2mm/s: black lines. Movements 2–6mm/s: green lines. Movements > 6mm/s: red lines. Recording time: 5min. B: The total distance moved within 5min in wildtype, grna −/−;grnb −/− mutants, DMSO-treated, and PTZ-treated larvae is shown. Wt-grna −/−;grnb −/−: p = 0.2386. Wt-DMSO: p = 0.0534. Wt-PTZ: ***p = 0.0002. DMSO-PTZ: **p = 0.004. C: A graph of the mean velocity of wildtype, grna −/−;grnb −/− mutants, DMSO-treated, and PTZ-treated larvae is shown. Time frame: 5min. Wt-grna −/−;grnb −/−: p = 0.5657. Wt-DMSO: p = 0.8081. Wt-PTZ: *p = 0.0137. DMSO-PTZ: **p = 0.0014. D: Percentage of time spent for movements with a velocity above 2mm/s in wildtype, grna −/−;grnb −/− mutants, DMSO-treated, and PTZ-treated larvae is plotted. Time frame: 5min. Wt-grna −/−;grnb −/−: p = 0.2585. Wt-DMSO: p = 0.0668. Wt-PTZ: **p = 0.0016. DMSO-PTZ: **p = 0.0037. B-D: n = 18. S.E.M. Mann-Whitney test (two-tailed).

